Southeast Florida Climate Indicators
Indicators are scientifically-based measurements that track trends in various aspects of climate change. These data provide clear evidence of the climate change occurring in Southeast Florida, which is having significant, measurable impacts on our people, environment, and economy.
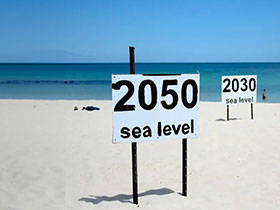
The physical indicators of climate change and variability are already manifesting in Southeast Florida. While sea level rise frequently receives the most attention in the region, there are other impacts of a changing climate that have consequences for communities. Understanding the future evolution of climatic patterns is extremely important for planning and management of agricultural, urban, and environmental systems, and reducing risks to communities.
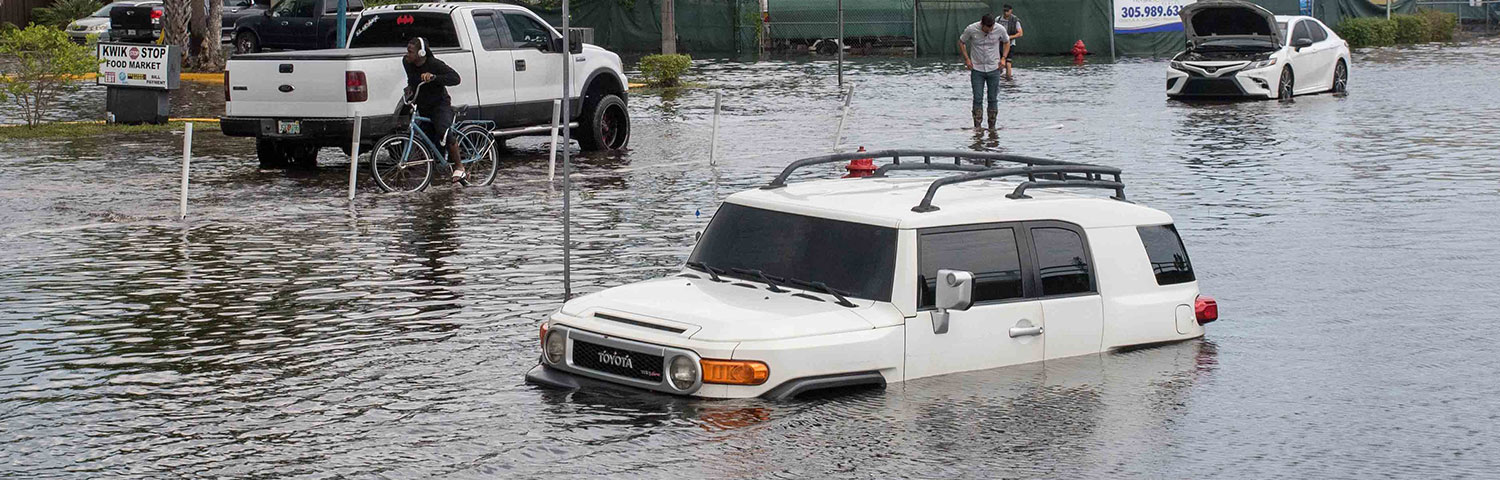
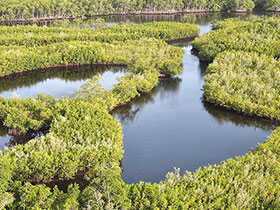
In Broward, Miami-Dade, Monroe and Palm Beach counties (the four-county Compact region), changes to the climate result in higher temperatures in the atmosphere and in the ocean, potential shifts in rainfall patterns, and more frequent extreme rain events. Rising sea levels are increasing groundwater levels, the severity and frequency of high tide flooding, and exacerbating saltwater intrusion in some areas. Elevated groundwater levels reduce drainage capacity and augment flood risk from rainfall events, even in inland areas. Further, natural systems are being impacted by changing conditions—from the inland migration of mangroves and coastal species, to the degradation of coral reefs from increasing ocean temperatures. Taken together, a changing climate and the impacts on Southeast Florida’s physical systems are resulting in cascading socioeconomic challenges.
The Compact endeavors to serve as a central repository for the best available, up-to-date, locally relevant scientific information on physical indicators of climate change in the region. Indicators are scientifically based measurements of observed phenomena that describe and facilitate communication about the various aspects of climate change. These data provide clear
evidence of the climate change occurring in Southeast Florida, which is having significant, measurable impacts on the region’s people, environment, infrastructure, and economy. This report, to the extent possible, also includes projections of future conditions, exploring the potential impacts of a changing climate based on plausible scenarios.
The Compact first developed the Southeast Florida Climate Indicators in 2016 through a technical work group with contributions from Broward, Miami-Dade, Monroe, and Palm Beach County staff, academic, and agency partners. The Compact updated the Climate Indicators in 2020 and again enlisted the support of technical experts across the academic community, and relevant state and federal agencies to update the indicators in 2025. The Compact intends for this information to help inform practitioners to advance regionally consistent planning, as well as educate elected officials, the media, and the general public regarding the consequences of climate change.
Changes in SEFL Climate & Impacts to Physical Systems
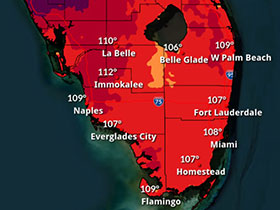
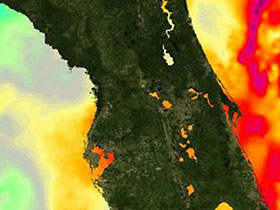
Climate is determined by the long-term pattern of oceanic and atmospheric conditions at a location. It is generally defined as “average weather,” usually described in terms of the mean and variability of temperature, precipitation, and wind over a period of time. The evidence that the climate system—the atmosphere, land, and ocean—is warming is unequivocal. A review of temperature data since 1895 for the southeast region demonstrates that the average temperature during the last three decades has been higher than in the previous decades. In each of the four Southeast Florida counties, minimum annual temperatures rose 0.7 to 0.8 °F per decade over the past 40 years (1984 to 2024) (NOAA, National Centers for Environmental Information, 2025). Warming temperatures and changing precipitation patterns have altered Southeast Florida’s “physical systems”—with a prominent impact on the ocean, which influences the region’s water resources in a myriad of ways. The following indicators show changes in temperature, heat index, precipitation, sea level, high tide flooding, saltwater intrusion, and sea surface temperature as a result of climate change.
Global Concentration of Carbon Dioxide
Since the beginning of the Industrial Revolution, human activities have caused significant increases in emissions of greenhouse gases in the atmosphere, such as carbon dioxide, methane, and nitrous oxides, in addition to natural emissions of these gases due to the biome carbon and nitrogen cycles. Major sources of carbon dioxide are the burning of fossil fuels such as coal, petroleum-based liquid fuels, and natural gas for electric power generation, transportation, and industrial processes. These greenhouse gases trap heat from the sun in a natural process called the “greenhouse effect,” which would otherwise be radiated back to space. Problematically, as the concentrations of these gases accumulate in the Earth’s atmosphere as a result of human activities, the Earth’s average temperature continues to rise.
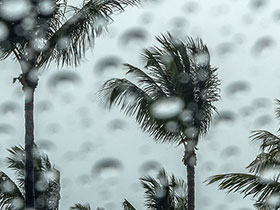
A warmer atmosphere resulting from increasing levels of greenhouse gases, such as carbon dioxide, can hold more moisture (approximately 7% for every degree Celsius). While higher temperatures will make heat waves more frequent and intense, the increased moisture may lead to heavier rainfall and flooding. A warmer atmosphere contributes to increasing heat in the ocean, leading to more intense storms, rising sea level, and changing wind patterns and ocean currents.
The monthly mean concentration of carbon dioxide has been measured at Mauna Loa Observatory on the island of Hawaii since 1958, and is the longest record of direct measurements of CO2 in the atmosphere. As of February 2025, the global average atmospheric carbon dioxide concentration was 427 parts per million (ppm), the highest recorded in human history—a level unprecedented in recent geologic history and within the timeframe of human civilization.

This collection of climate indicators was created with the technical expertise and significant contributions from Florida International University; University of Miami; South Florida Water Management District; National Oceanic and Atmospheric Administration, U.S. Geological Survey, and county and municipal staff from the Compact region.