
Climate Indicators
Precipitation
Observed Precipitation
Southeast Florida has a wet season and dry season based on the rainfall amount, with May and October considered transitional months. The six months from November through April are considered the dry season. The four months from June through September are considered the wet season. Long-term averages indicate South Florida has an annual rainfall of 52 to 53 inches, with roughly three-quarters of the rainfall occurring in the wet season and the transitional months. Spatial variability of rainfall is wide-ranging and highly influenced by the oceans surrounding the peninsula, the large lakes within the interior of the state, as well as sea breeze and tropical storm occurrences. Identifying trends in extreme rainfall in Southeast Florida is challenging due to limited data availability, particularly at subdaily time scales. It is also difficult to attribute the historical changes in rainfall to climate change directly, as rainfall changes could be cyclical and affected by intra- and multi-decadal natural climate variability, such as El Niño and other recurrent climate phenomena. Changes in rainfall patterns could impact stormwater volumes and the amount of available fresh water, potentially causing more frequent flooding events or prolonged periods of drought.
The South Florida Water Management District (SFWMD or District) has conducted an analysis of the frequency and long-term trends in available historical rainfall data in Southeast Florida utilizing observed rainfall data until 2018. Overall, the District did not identify significant upward or downward trends in average annual, seasonal or monthly rainfall other than localized observations. The District is currently updating these trend analyses to include observed data through 2024 and are improving data quality, which could be a limiting factor in identifying trends over time. According to the SFWMD, given predicted increases in the frequency and intensity of extreme hydrological events, local changes to extreme wet and dry conditions are likely in future years.
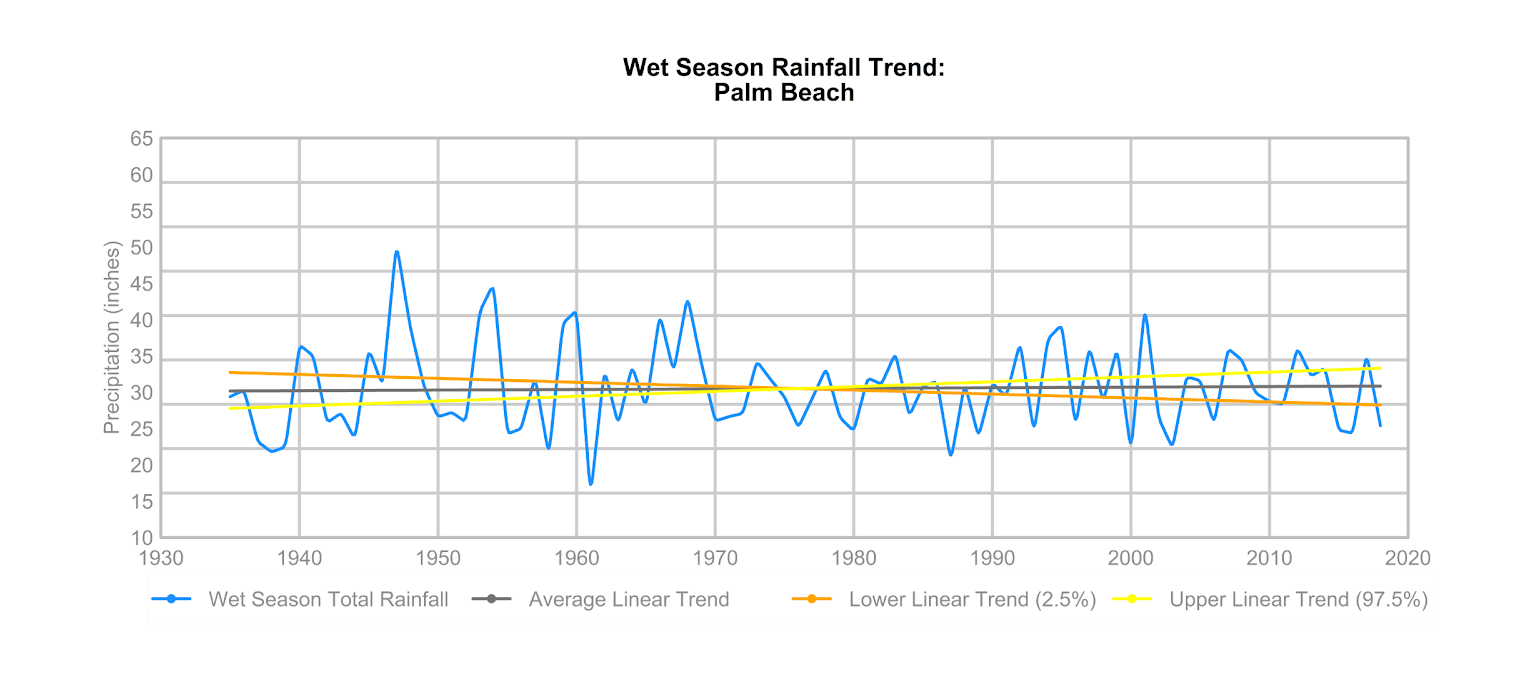
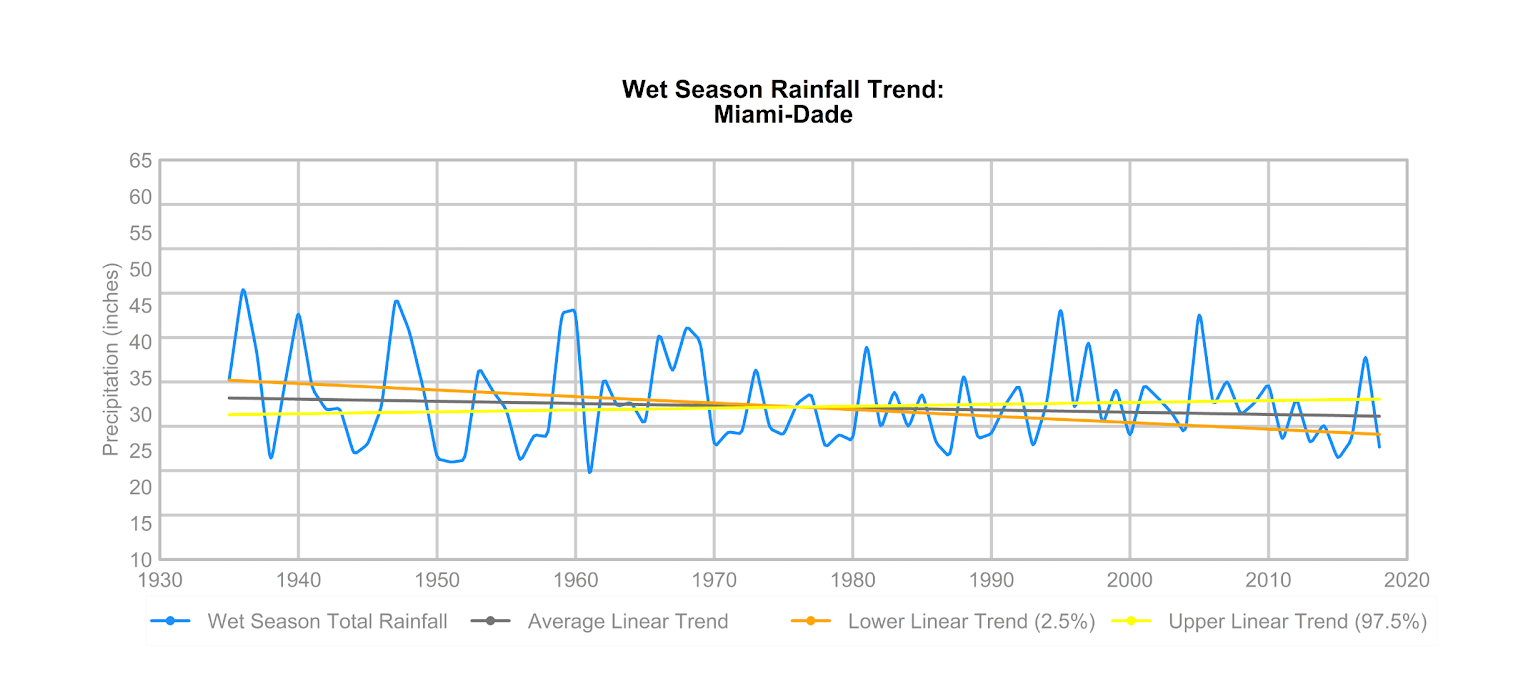
Analysis of observed total annual wet season rainfall trends from 1935 to 2018 from the SFWMD’s Resilience Metrics Hub platform is presented in the charts below for Broward, Miami-Dade, and Palm Beach counties (counties within the SFWMD area), exhibiting significant natural variability but no systematic trends.
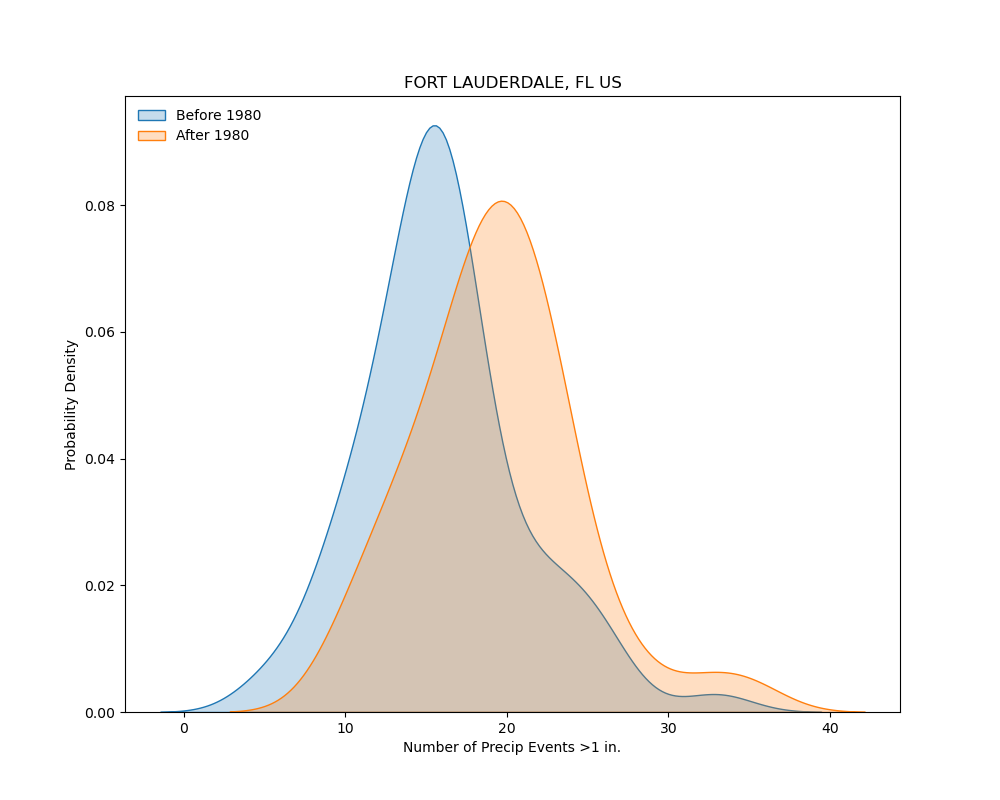
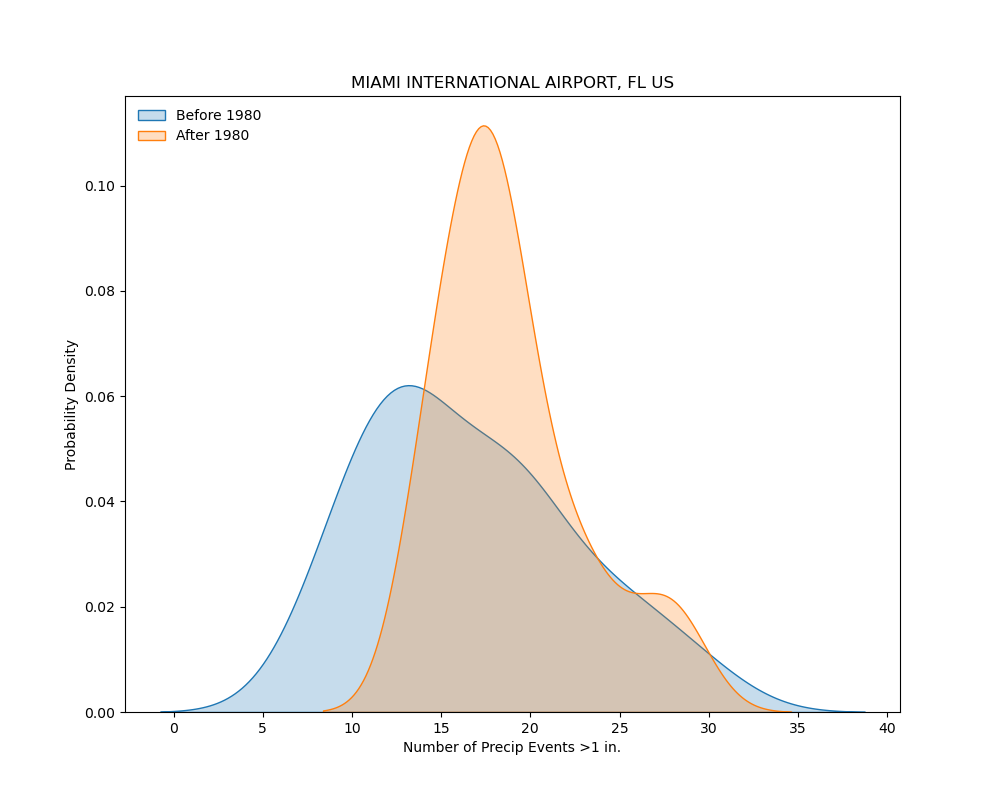
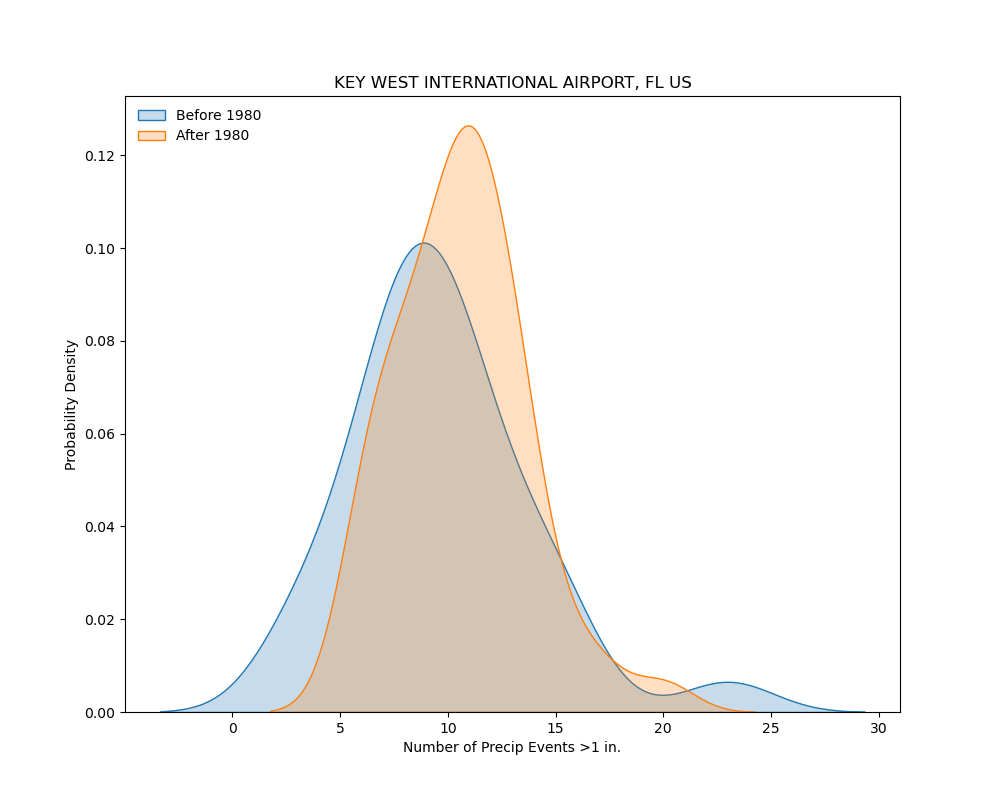
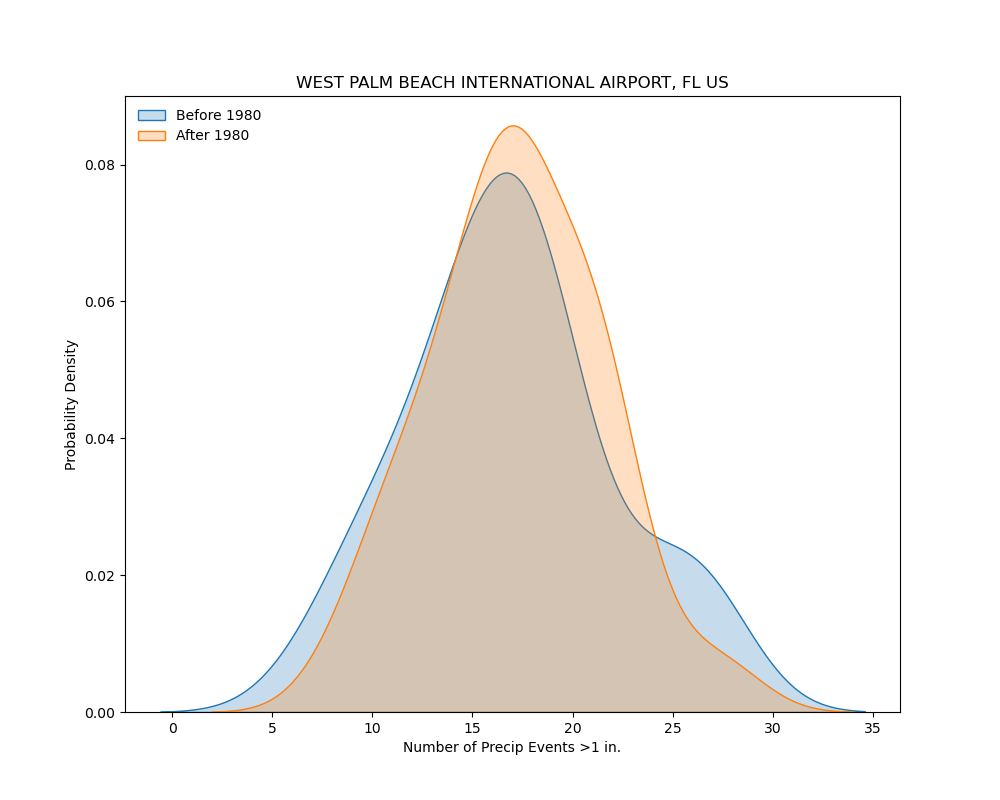
The second chart analyzes the probability density of the number of daily rainfall events exceeding one inch, using precipitation data from NOAA’s National Centers for Environmental Information (NCEI) for stations located at Fort Lauderdale International Airport (Broward County), Miami International Airport (Miami-Dade County), Key West International Airport (Monroe County), and the Palm Beach International Airport (Palm Beach County). The purpose of this assessment was to determine the potential change in the frequency of moderate rainfall events (defined here as one inch or above). The trend in the number of one-inch events appeared to have increased since about 1980 at all four locations, and therefore, that year was
used to split the datasets. The frequency of events was expressed as a probability distribution, before and after 1980. These plots demonstrate a clear trend (shift in the distribution) of increasing frequency of occurrence after 1980 across all four stations. While there was no attempt to determine the statistical significance of this shift, the implication of more frequent moderate events during more recent decades may imply a similar increase in the flood frequency due to such events. Further research is needed to validate this finding.
There has been a concern of a potential increase in major precipitation events for sub-daily duration (lasting less than 24 hours). A notable example of this is the deluge of 25 inches of rain over about 12 hours in Fort Lauderdale in April 2023. Similar events appear to occur more frequently across the State of Florida, particularly those associated with tropical systems. Unfortunately, there is limited continuous data on sub daily rainfall in the region to properly assess the statistical trends. Given the importance of large rainfall events, further work is needed to determine current and future trends in extreme rainfall events.
Sources: Wet season rainfall trends are provided courtesy of the South Florida Water Management District Resilience Metrics Hub platform. Probability density plots use data from NOAA National Centers for Environmental Information (NCEI).
Broward County
Wet Season Rainfall Trend: Broward
Fort Lauderdale, FL, US
Miami-Dade County
Wet Season Rainfall Trend: Miami-Dade
Miami International Airport, FL, US
Monroe County
Key West International Airport, FL, US
Palm Beach County
Wet Season Rainfall Trend: Palm Beach
West Palm Beach International Airport, FL, US
Sources: Wet season rainfall trends are provided courtesy of the South Florida Water Management District Resilience Metrics Hub platform. Probability density plots use data from NOAA National Centers for Environmental Information (NCEI).
Projected Rainfall Intensification
Globally, the intensification of extreme rainfall has been widely observed and linked to climate change, with studies confirming increases in heavy precipitation worldwide. Traditional estimates of extreme rainfall often assume a stationary climate, overlooking changes in atmospheric moisture and other meteorological factors. Research indicates that extreme daily precipitation has risen over the past six decades and is expected to continue increasing, with intensities scaling approximately 7% or higher per degree Celsius of warming, following the Clausius-Clapeyron (CC) relationship. However, this scaling rate varies by region, temperature, and moisture availability, with some areas experiencing precipitation increases at rates exceeding 7%. Short-duration storms are projected to see the most significant intensification, heightening flood risks, particularly in arid regions. While thermodynamic changes driving increased atmospheric moisture are well understood, uncertainties remain regarding dynamic effects such as storm intensity, updraft within a storm, and the influence of large-scale atmospheric circulation.
Communities in Southeast Florida frequently experience flooding due to heavy rainfall, and future conditions may worsen due to changing patterns of rainfall extremes. Historically, engineers and policymakers have relied on “design storms” derived from past data, but research indicates that these methods are unreliable for predicting future rainfall patterns as they fail to account for changing rainfall intensity due to a warmer atmosphere and assume the historical climate data will provide the basis for future conditions. Poorly or under-designed drainage systems may fail under increasing rainfall intensity, leading to frequent flooding and infrastructure damage.
The U.S. Geological Survey (USGS), in collaboration with the South Florida Water Management District (SFWMD) and Florida International University (FIU), has expanded studies statewide to support stormwater infrastructure planning. While climate models still contain uncertainties, approaches that use Change Factors (CFs, adjustments to rainfall intensity) help to account for future conditions. Change factors greater than 1.0 (one) represent future rainfall increase, and less than 1.0 (one) represent rainfall decrease for a given event. The USGS released statewide CFs in 2023 to assist in flood resilience planning. The estimates of Change Factors are available from the USGS Data Release,6 and they cover a range of Representative Concentration Pathways (RCPs) associated with projected climate model datasets, event durations, and return periods for several locations throughout the state. A rainfall return period is the likelihood that a similar rainfall event will occur an equal number of times, or be exceeded a certain number of times, each year or over a range of years.
The Florida Flood Hub for Applied Research and Innovation at University of South Florida, established by the State of Florida, is actively engaged in updating statewide Change Factors, with the latest global climate models, and they are expected to be available by the end of 2025. For the South Florida region, SFWMD has published the CFs until the Flood Hub results are available, based on the 2023 USGS study. For the counties in the Southeast Florida region, the median values of CFs have been reproduced in Table 1. The full dataset from SFWMD is available from its Resilience Metrics platform.
Moving forward, probabilistic and physically based regional climate modeling approaches may help address these uncertainties and improve projections of extreme rainfall patterns.
