Climate Indicators
Sea Surface Temperature
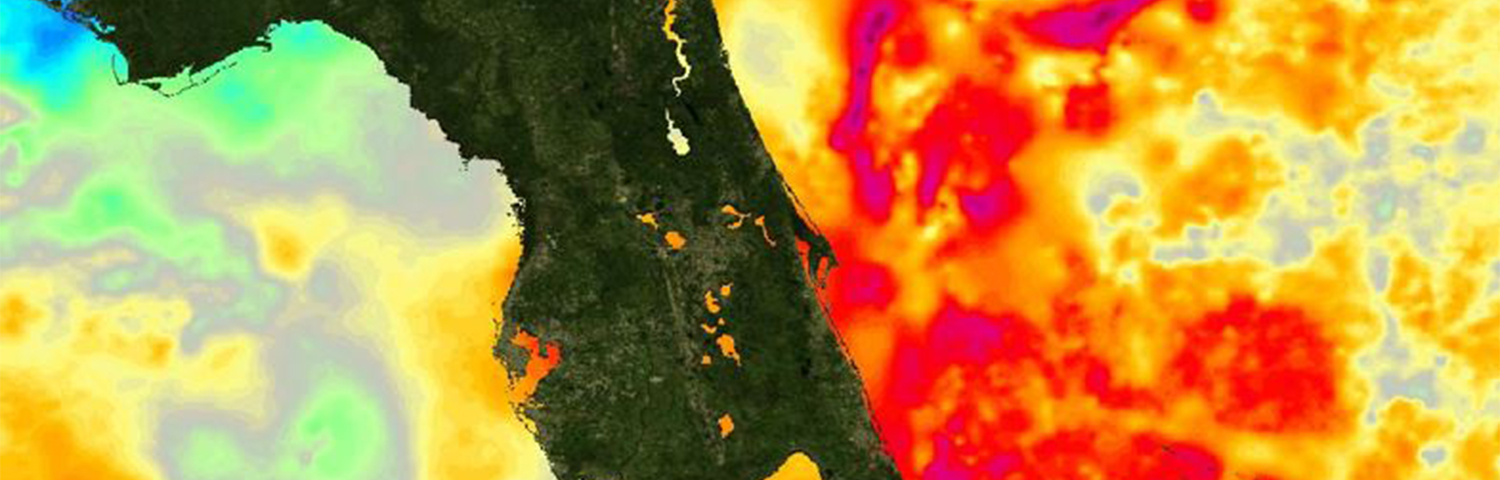
More than 90% of the excess heat associated with warming that has happened on Earth over the past 50 years has been transferred to the ocean. As the oceans absorb more heat, sea surface temperature increases, and the ocean circulation patterns that transport warm and cold water around the globe change. In Southeast Florida, fluctuations in sea surface temperature, both high and low, have implications for the health of marine life, particularly corals, which are highly sensitive to temperature changes. According to Coral Reef Watch, the threshold for coral bleaching is one degree Celsius (1°C) above the Max Monthly Mean; however, new research indicates that the bleaching threshold for Florida is increasing by almost 1°C over the last decade, which is about 10x faster than any other previous estimates from anywhere else in the world. In 2023, the warmest ever sea surface temperature was recorded, with a sensor in Manatee Bay near Everglades National Park recording 101.1°F. Prolonged elevated water temperatures in 2023 resulted in the most significant coral bleaching event recorded in Florida, with many reefs having 100% of the corals bleached. Coral reefs in Florida have enormous economic value, underpinning critical industries such as tourism, recreation, and fisheries, while also providing significant coastal protection.
This sea surface temperature data was obtained from NOAA 1/4° Daily Optimum Interpolation Sea Surface Temperature (OISST), which is a long-term climate data record that incorporates observations from different platforms (satellites, ships, buoys, and Argo floats) into a regular global grid. The chart shows the summertime (July, August, September) average sea surface temperature for the south Florida region, encompassing the tip of the Florida peninsula from 1982 to 2024. Over this period, we see an increase in summertime sea surface temperature in the region of nearly half a degree (0.49 °F) per decade. The animated map below the chart is a spatial illustration of the data points in the chart.
There is a very close agreement between the trend in the minimum temperature shown in the first figure in the Temperature & Heat Index section (+0.52 °F/decade) and the trend in the regional sea surface temperature shown above (0.49 °F/decade) over the past half century. This strongly suggests that the increasing warmth of the water surrounding South Florida is governing the trend of the overnight low temperatures.
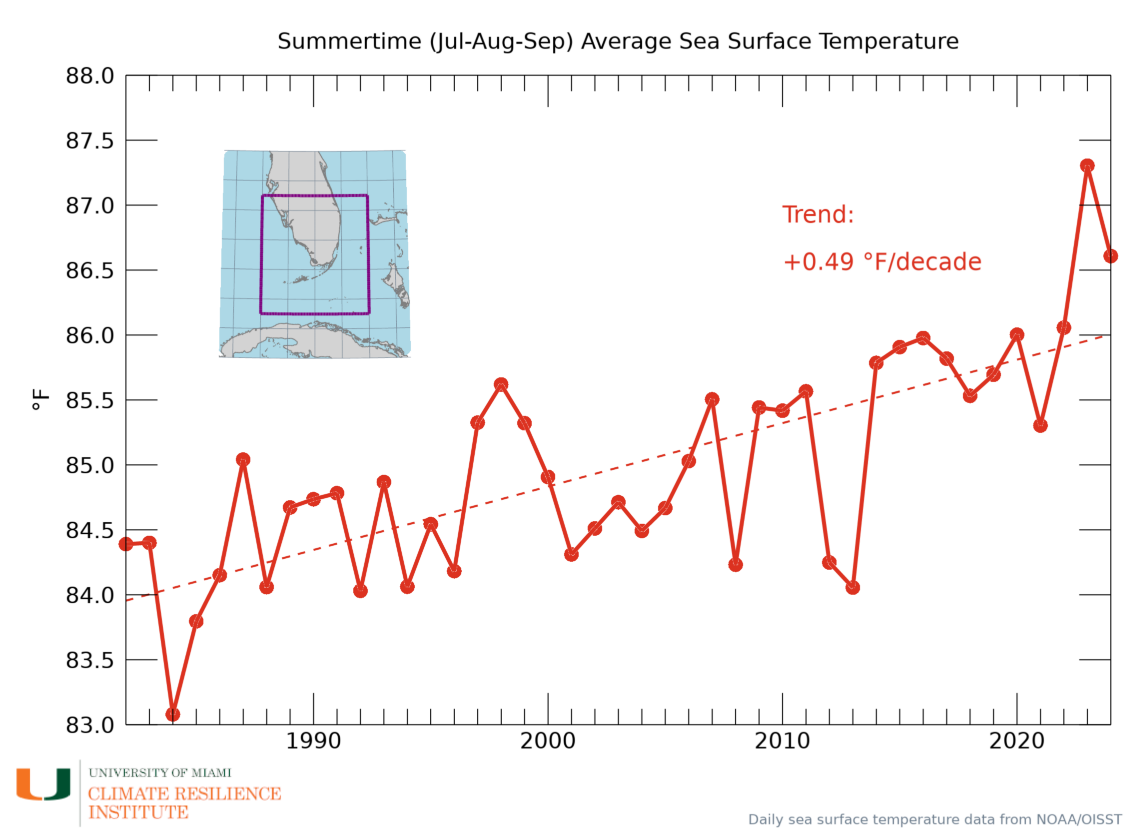
Source: NOAA Daily Optimum Interpolation Sea Surface Temperature (OISST). The chart and map are provided courtesy of the University of Miami’s Climate Resilience Institute, 2025.
Projected Sea Surface Temperature
The chart below shows the averaged projected sea surface temperature for the South Florida peninsula, for the summertime months (July, August, September), from 2007 to 2100. This chart is based on the National Science Foundation National Center for Atmospheric Research (NCAR) Community Earth System Model (CESM)1.2 run at 0.1 degrees globally and the RCP8.5. RCP8.5 represents a possible future in which global emissions of heat-trapping gases continue to
increase through 2100, or what is referred to as a “higher emissions pathway.” The chart
demonstrates a clear continuation of increasing sea surface temperature, projecting an
increase by roughly 6°F by the end of the century.
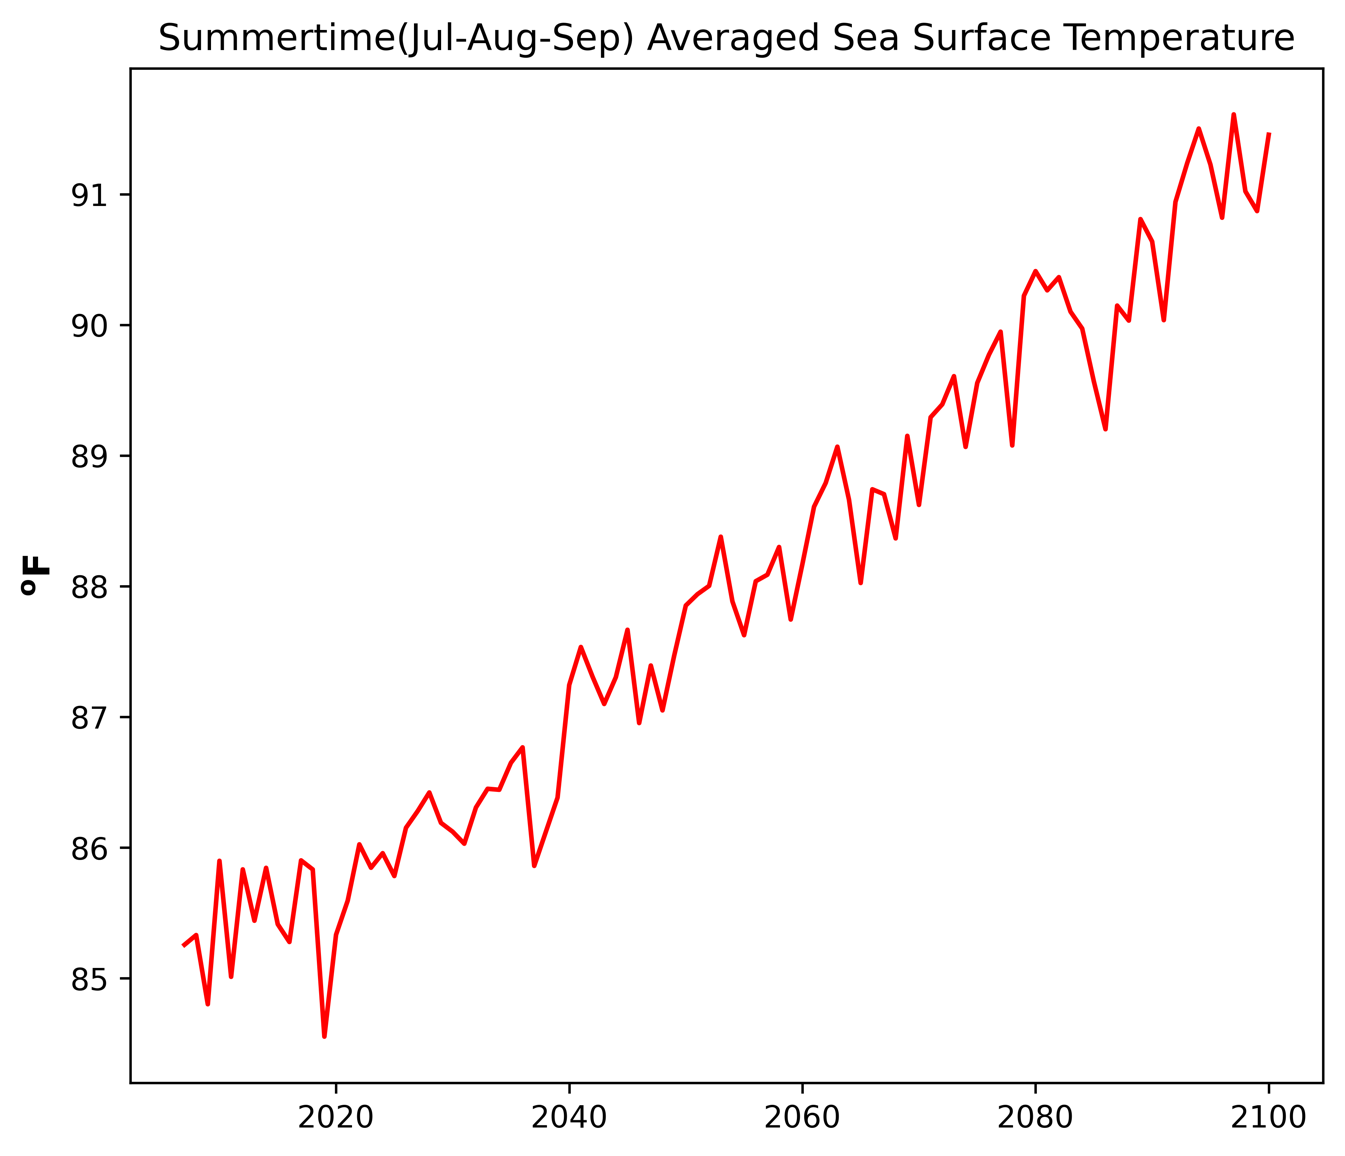
Source: National Science Foundation National Center for Atmospheric Research (NCAR) Community Earth System Model (CESM)1.2.