Regional Climate Assessment Snapshot
In 2021, the Compact developed the Climate Assessment Tool (C-CAT) to better understand local governments’ actions on 11 key mitigation and adaptation priorities and to increase communication and transparency around regional progress.
All 115 county, municipal, and tribal governments were invited to participate in a voluntary survey which, in the first year it was administered, provided a baseline understanding of recent regional advancements relevant to local government planning and implementation through the calendar year 2020. In 2024, the Compact administered the voluntary survey for the fourth time, assessing additive progress made throughout calendar years 2021, 2022, and 2023 respectively.
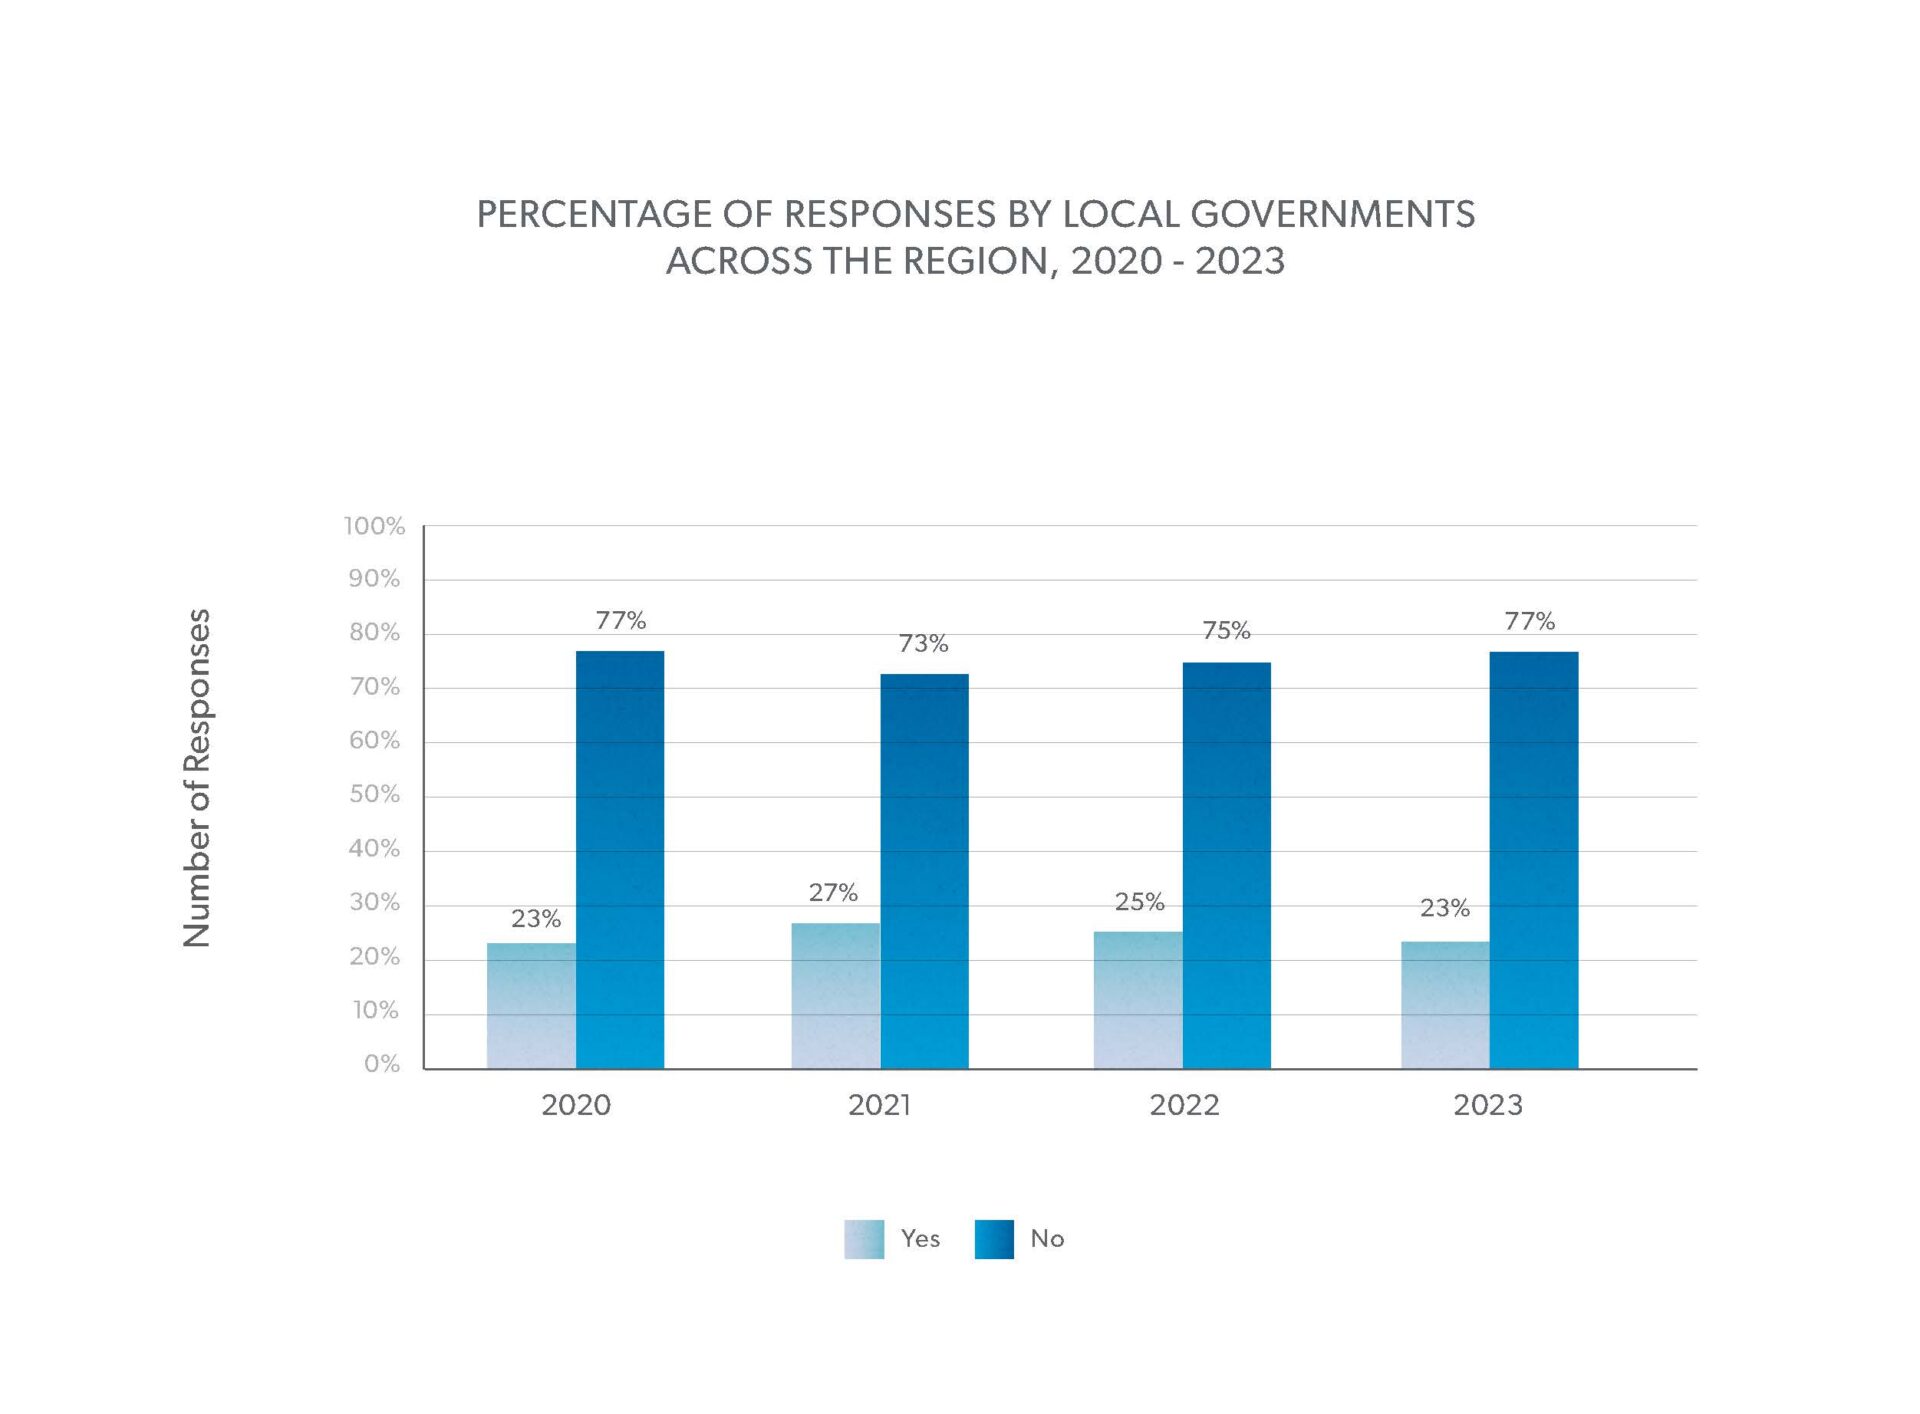
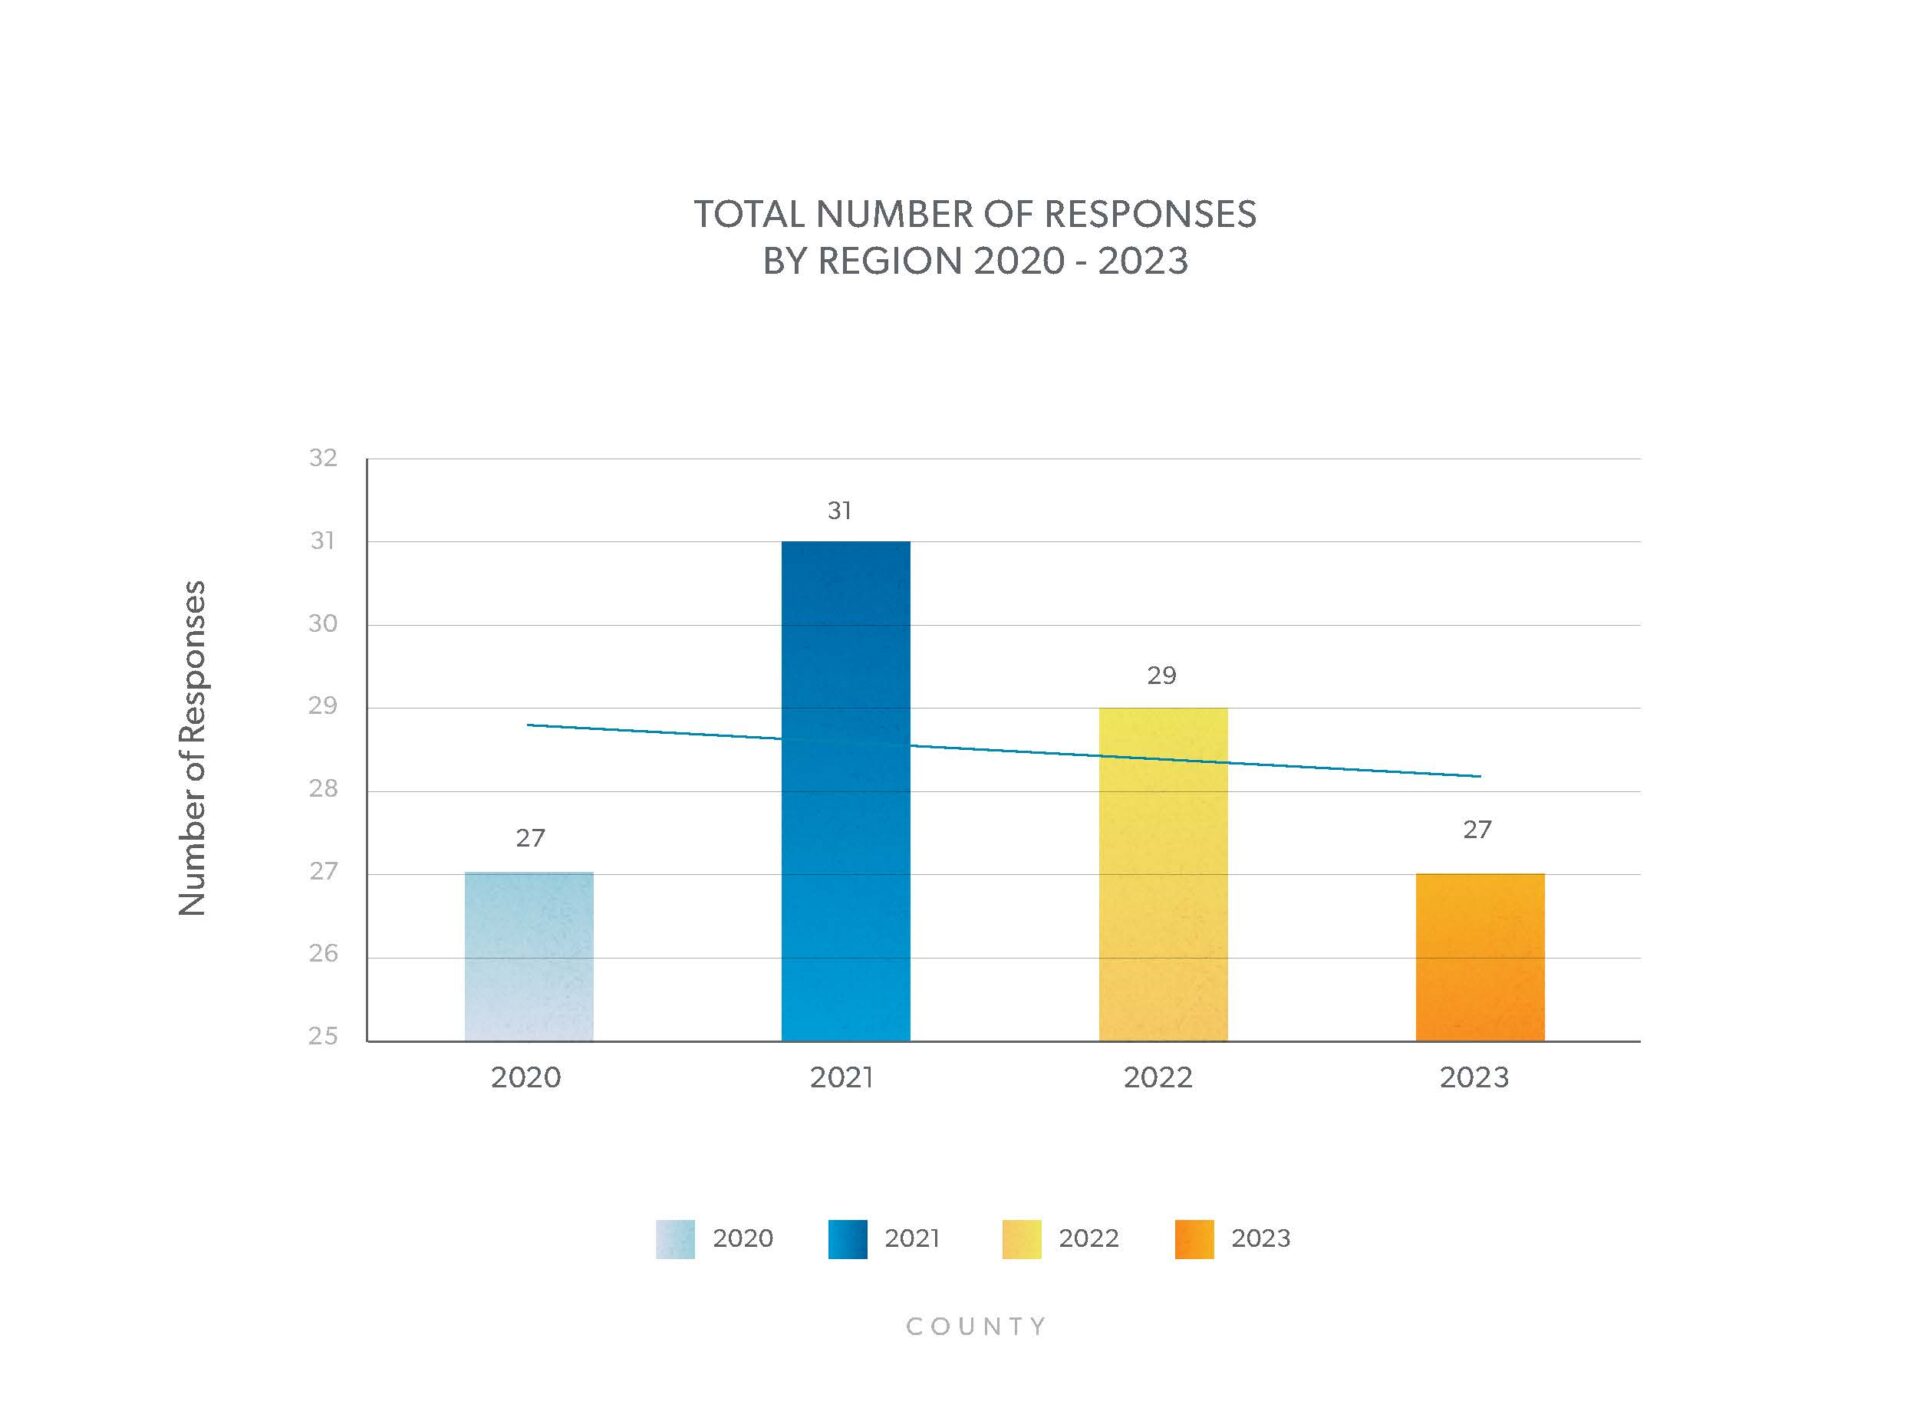
A total of 27 (23%) of the local and tribal governments in the region responded to the 2023 survey, as compared to 29 (25%) in 2022, the third year the survey was administered — a 7% decrease in participation. The charts and graphs below are intended as a snapshot of the progress made on the 11 priority mitigation and adaptation actions by the 27 local and tribal governments who completed the survey. To view individual government responses, please see the local government matrix, where all survey responses can be downloaded.
About the survey responses
Given the limited capacity of many municipalities and the desire to avoid placing additional burdens on their limited resources through this survey process, the Compact designed the survey to capture coarse information regarding broad categories of mitigation and adaptation actions. While the results demonstrate positive progress toward both the mitigation and adaptation priorities outlined among survey respondents, there is still significant work to be done across various priorities, as well as the work to ensure equity is at the center of climate change action—which will undoubtedly require continued commitment and ambition, funding and collaboration. The documentation provided by the respondents can be found in the local government matrix below.
The Southeast Florida region has much at stake from climate change impacts and enormous opportunity for a strong response. Fundamentally, this response requires a transformation of government operations to ensure that resilience, equity, and low-carbon principles are embedded holistically and as a matter of course. It should also be noted that as a self-assessment tool, the Compact does not validate the activities reported via the survey. Local and tribal governments were encouraged to include backup documentation to support their self-reporting (i.e. linking to resolutions, budget items, referenced plans, etc.), and to provide a public comment/resident review period.
Regional Snapshot
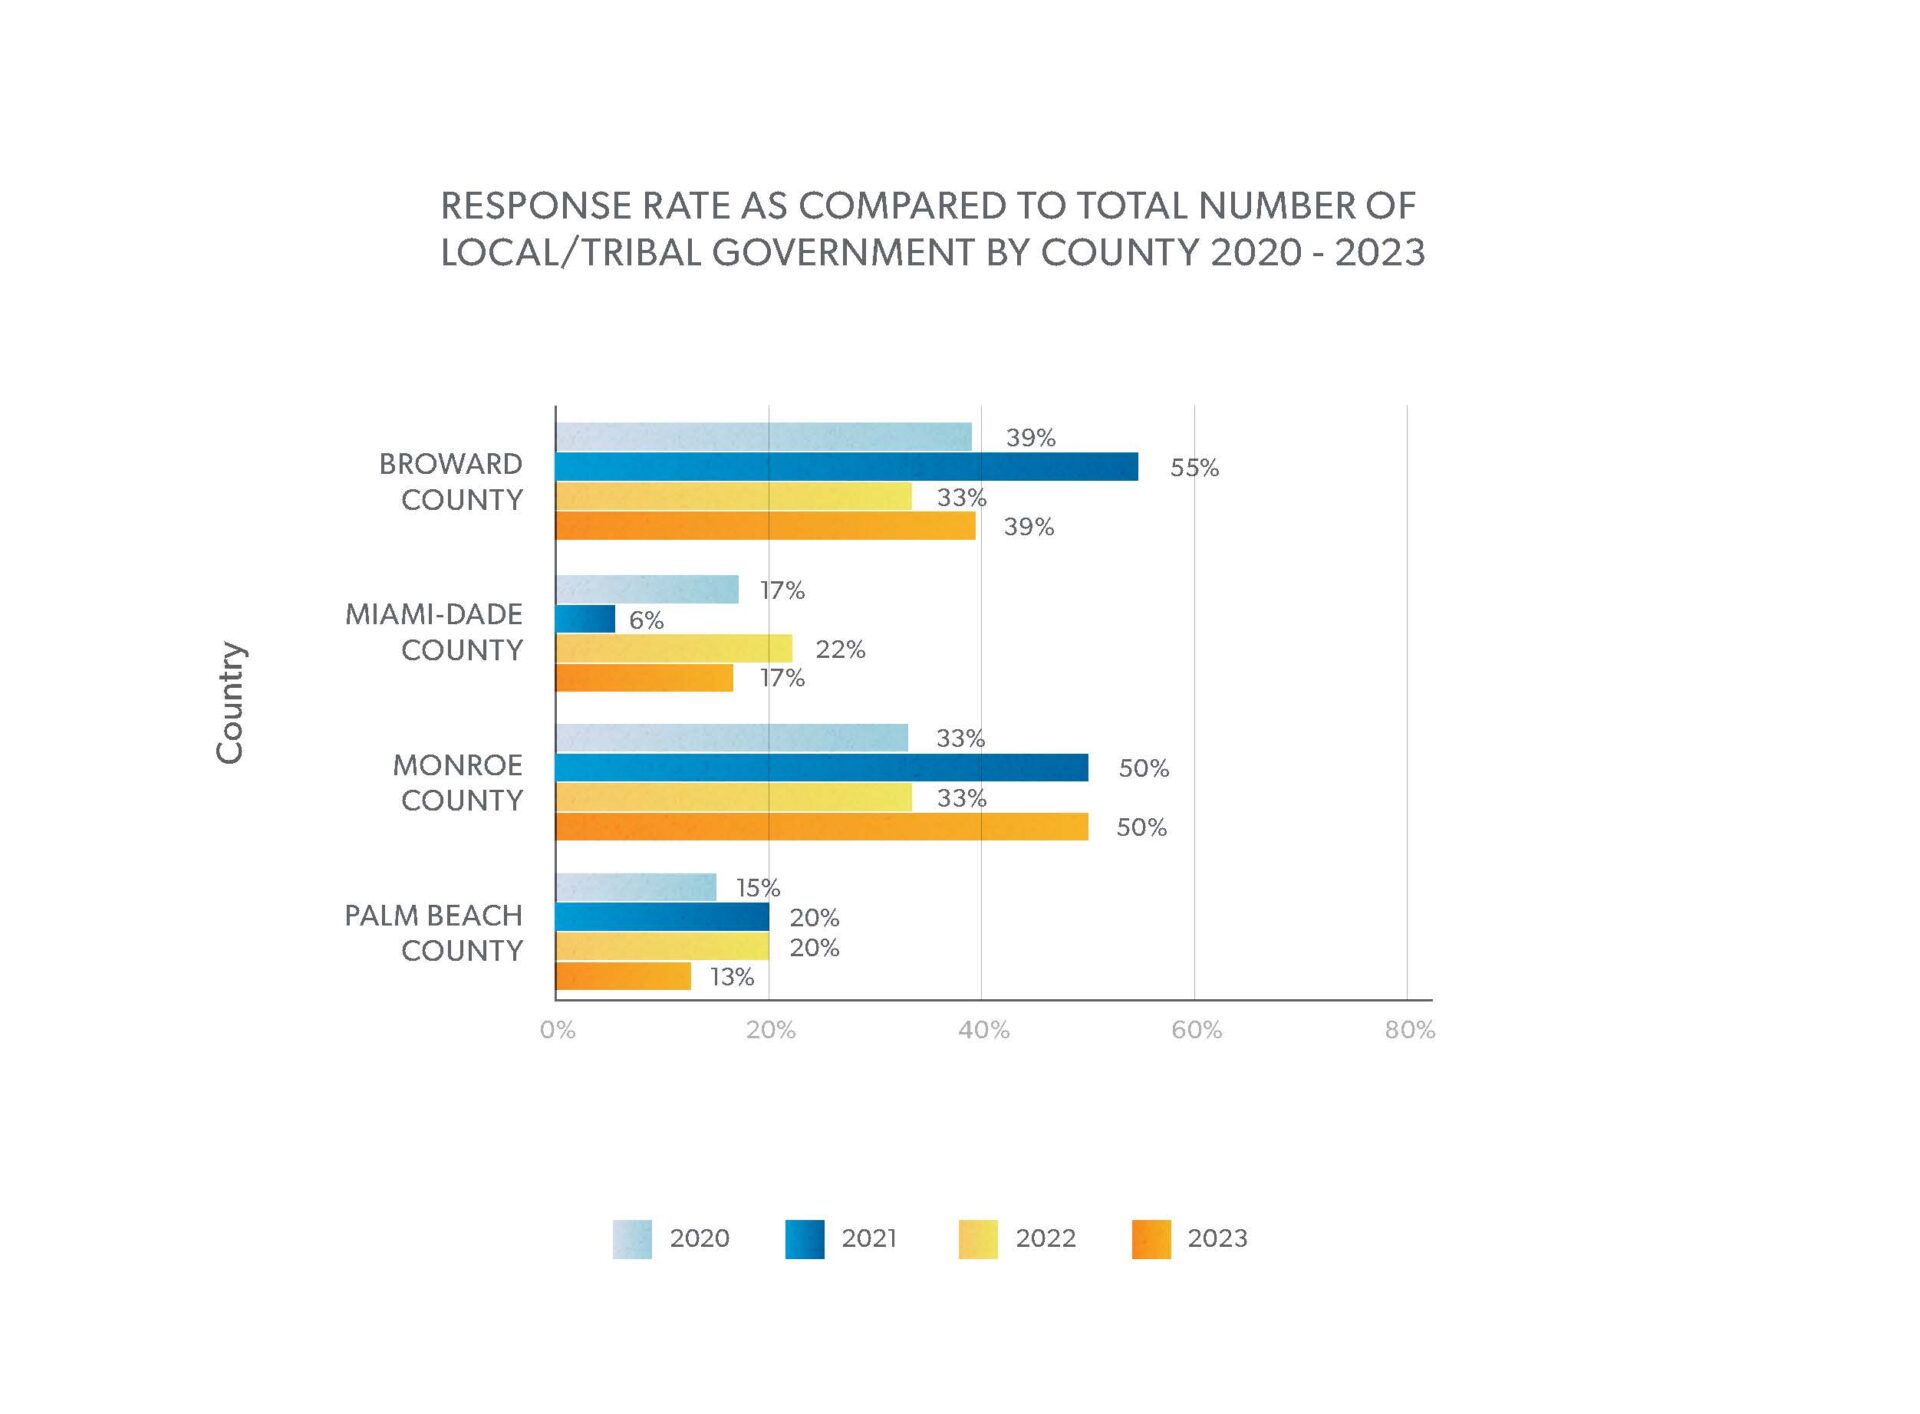
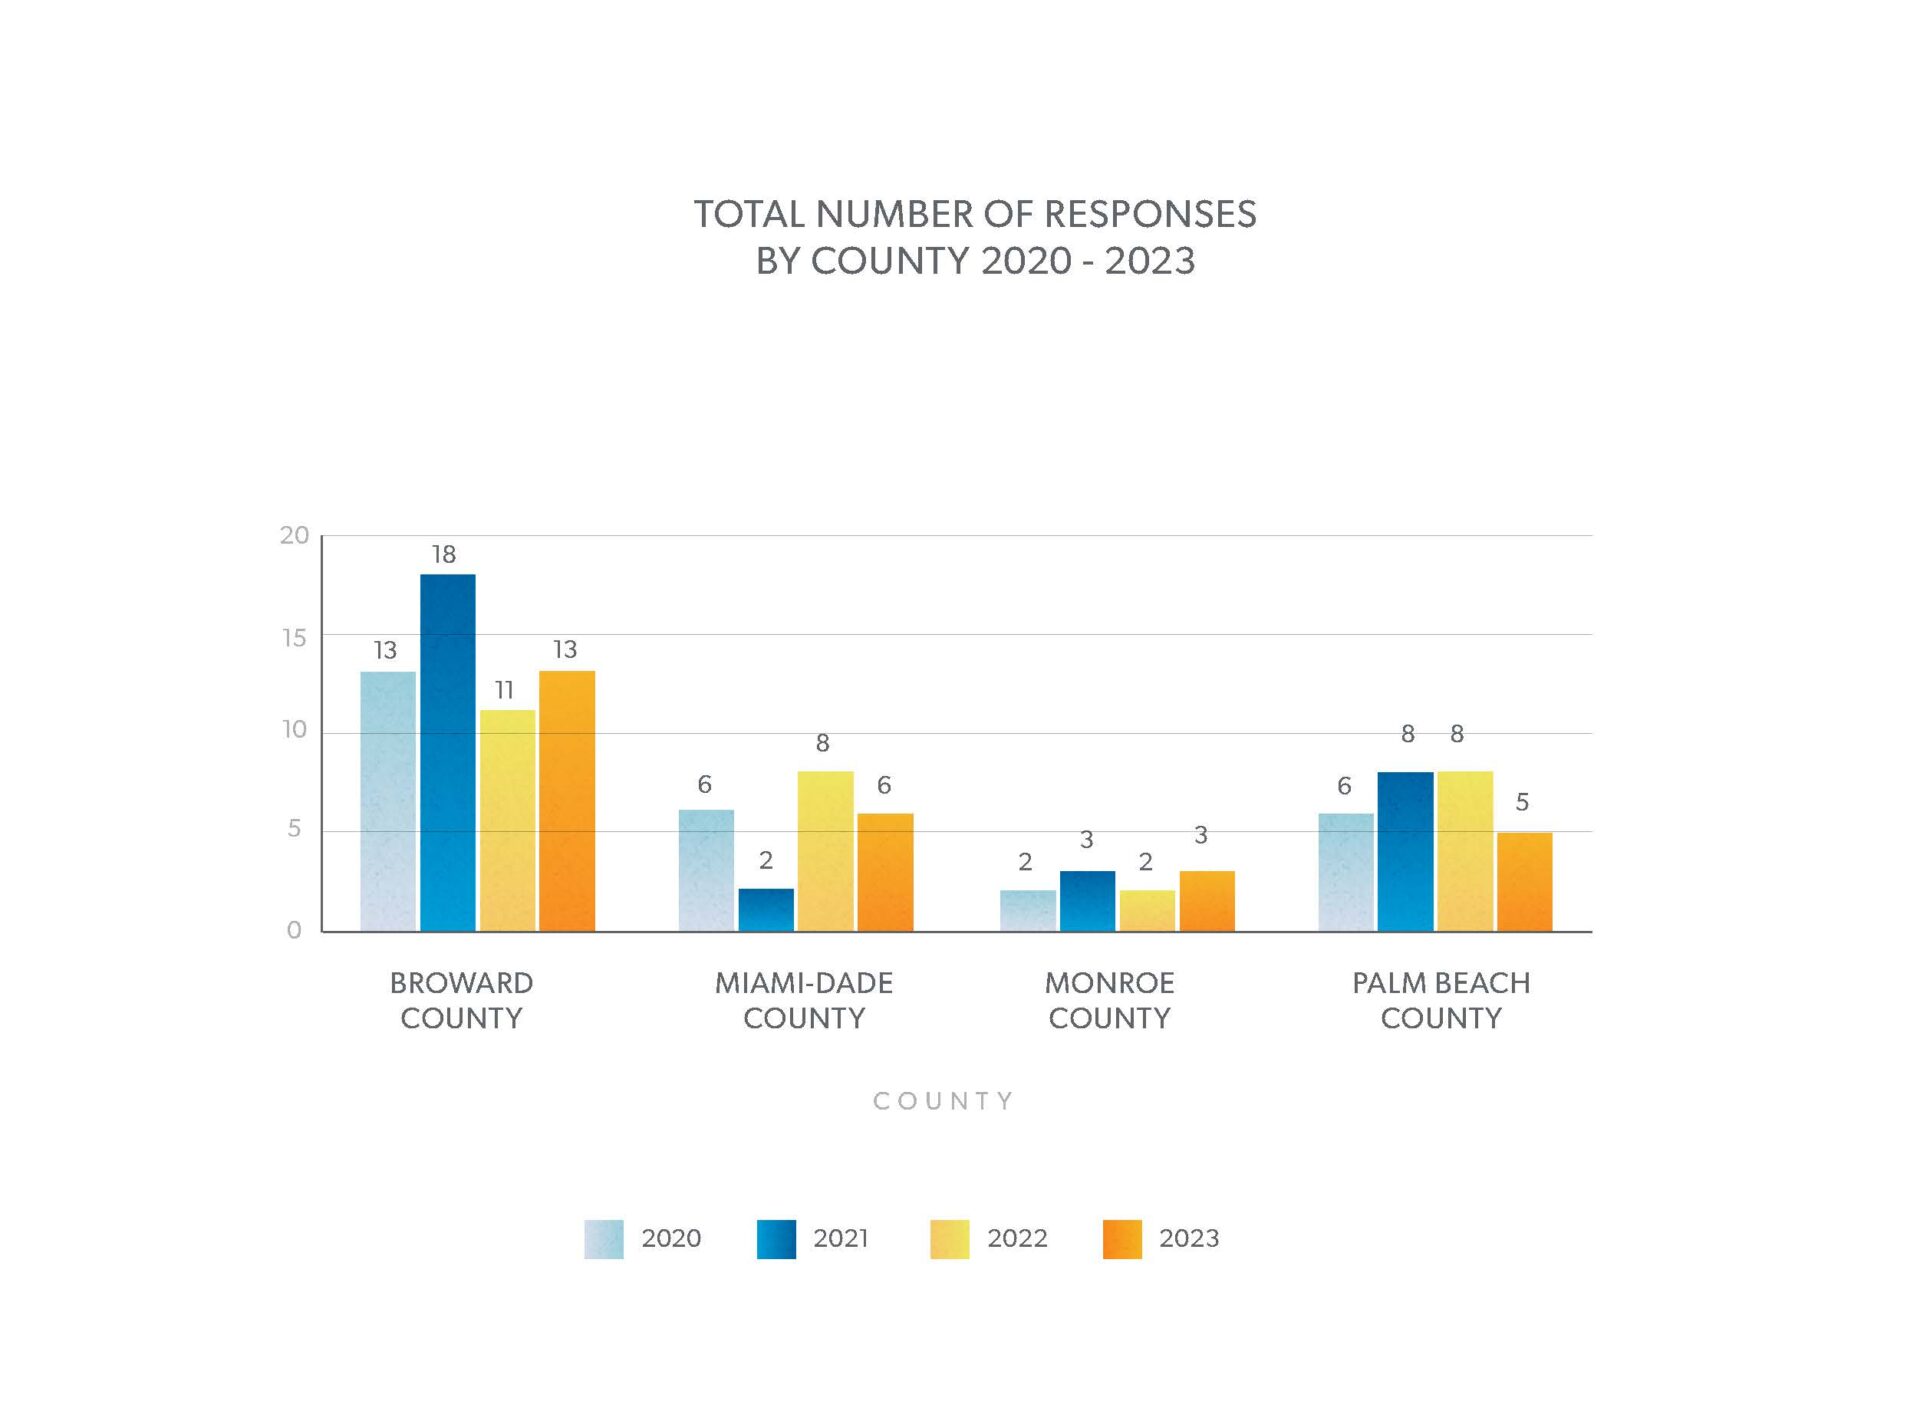
How many local/tribal governments in Southeast Florida (inclusive of the Compact region of Broward, Miami-Dade, Monroe and Palm Beach) are reporting on their climate change activities?
Twenty-seven local and tribal governments in the region, inclusive of Broward, Miami-Dade, Palm Beach, and Monroe counties responded to the survey. Thirty-nine percent of the total local/tribal governments in Broward County, 17% of Miami-Dade’s local/tribal governments, 50% of Monroe’s local/tribal governments, and 13% of Palm Beach’s local/tribal governments responded to the survey.
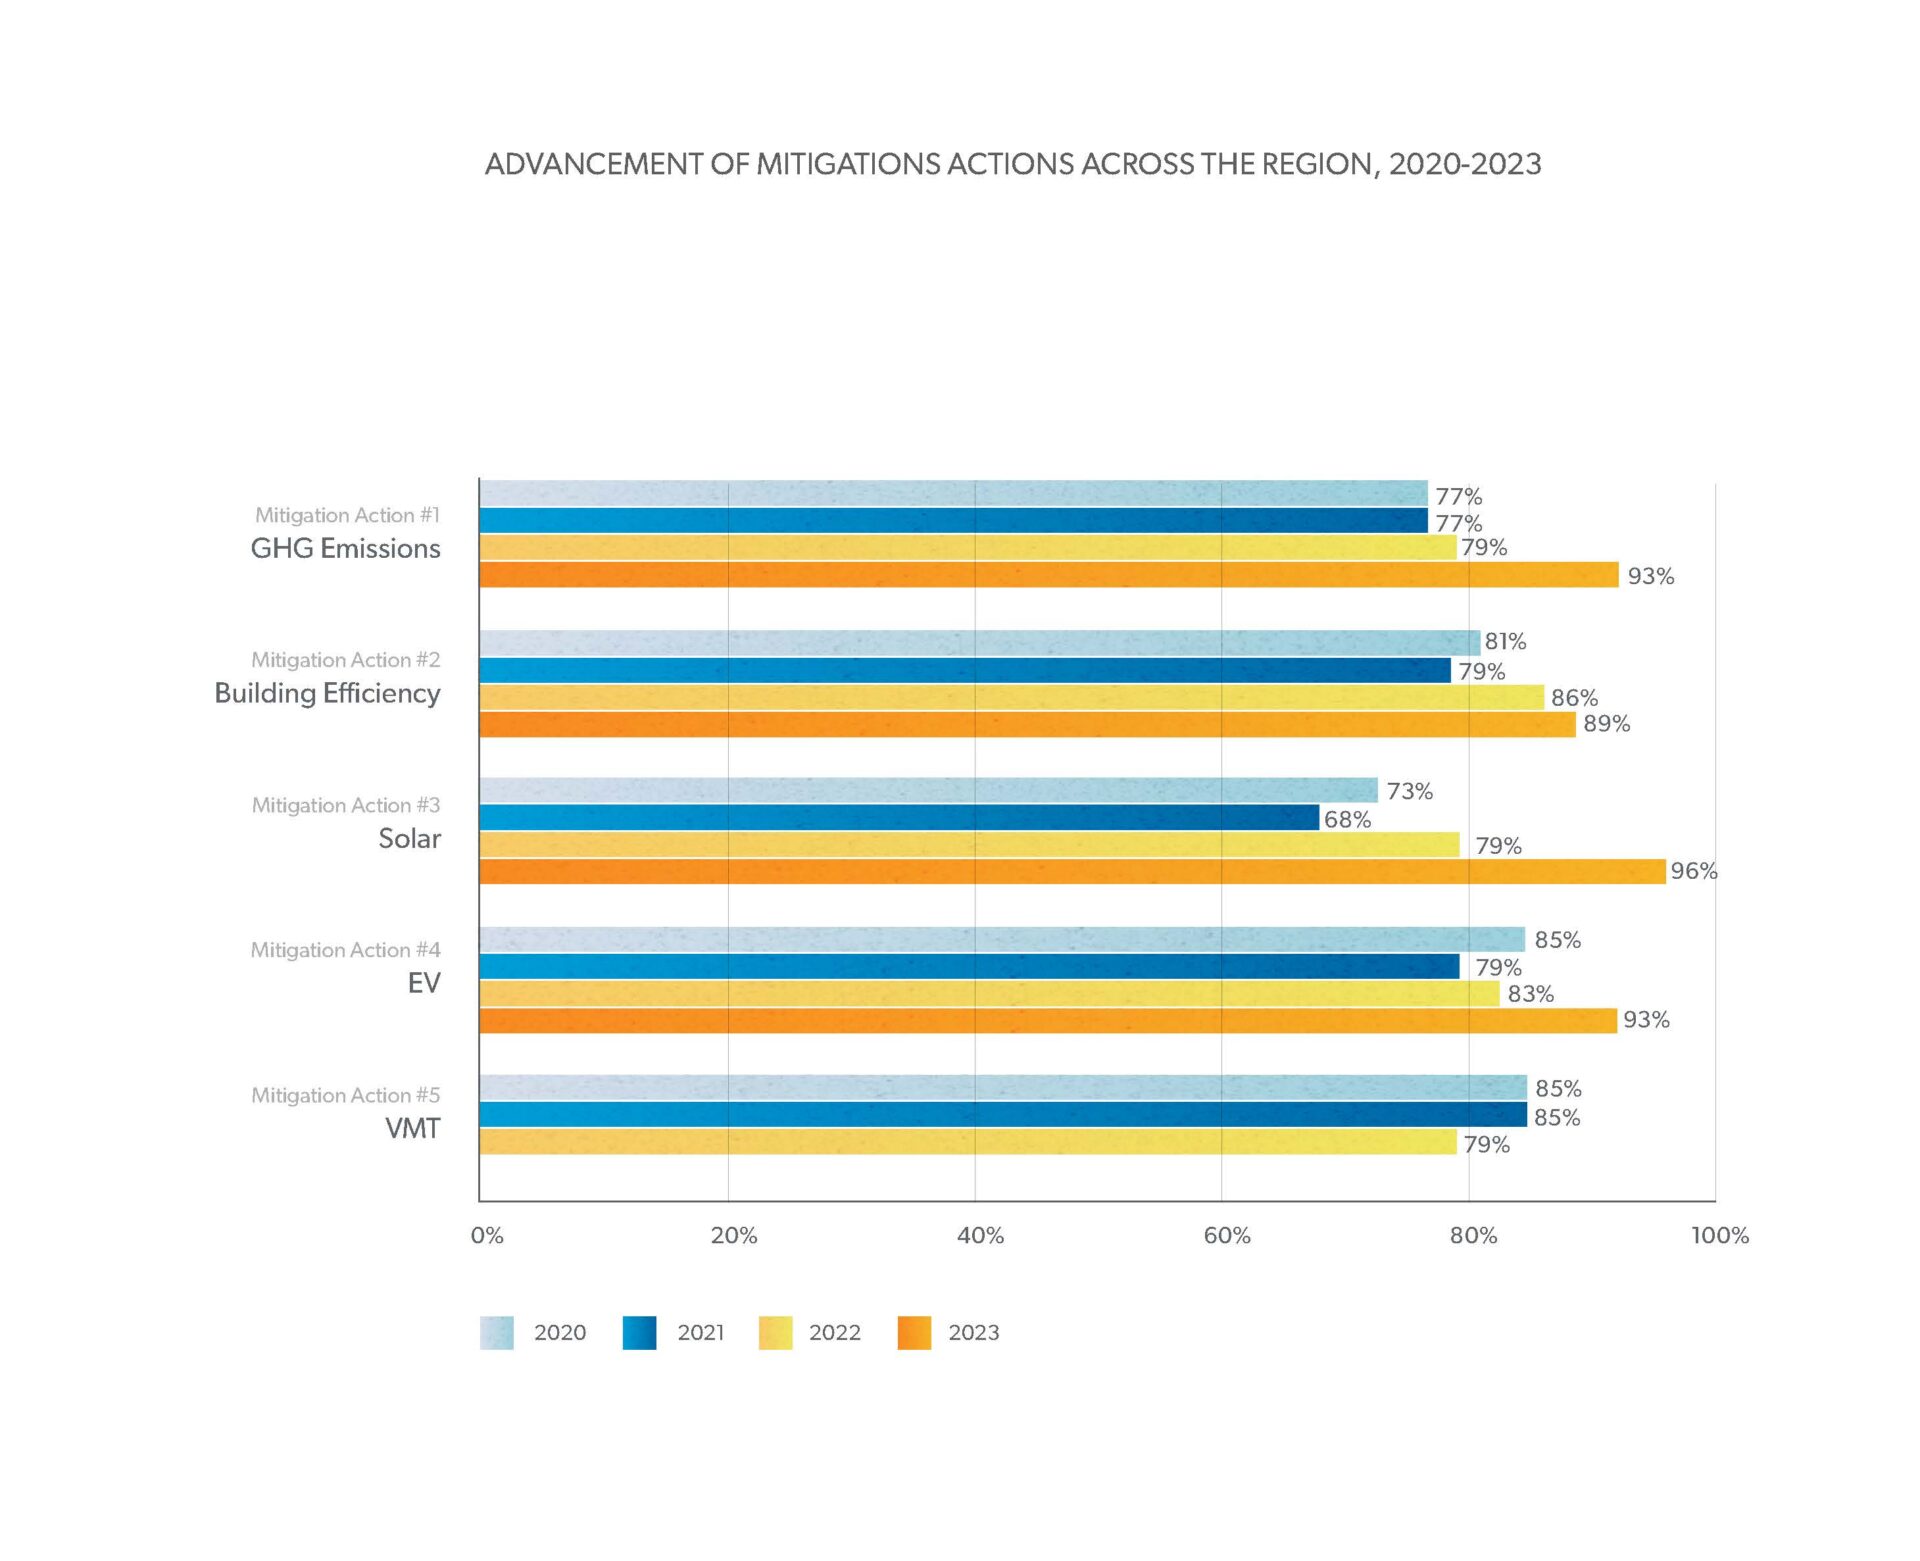
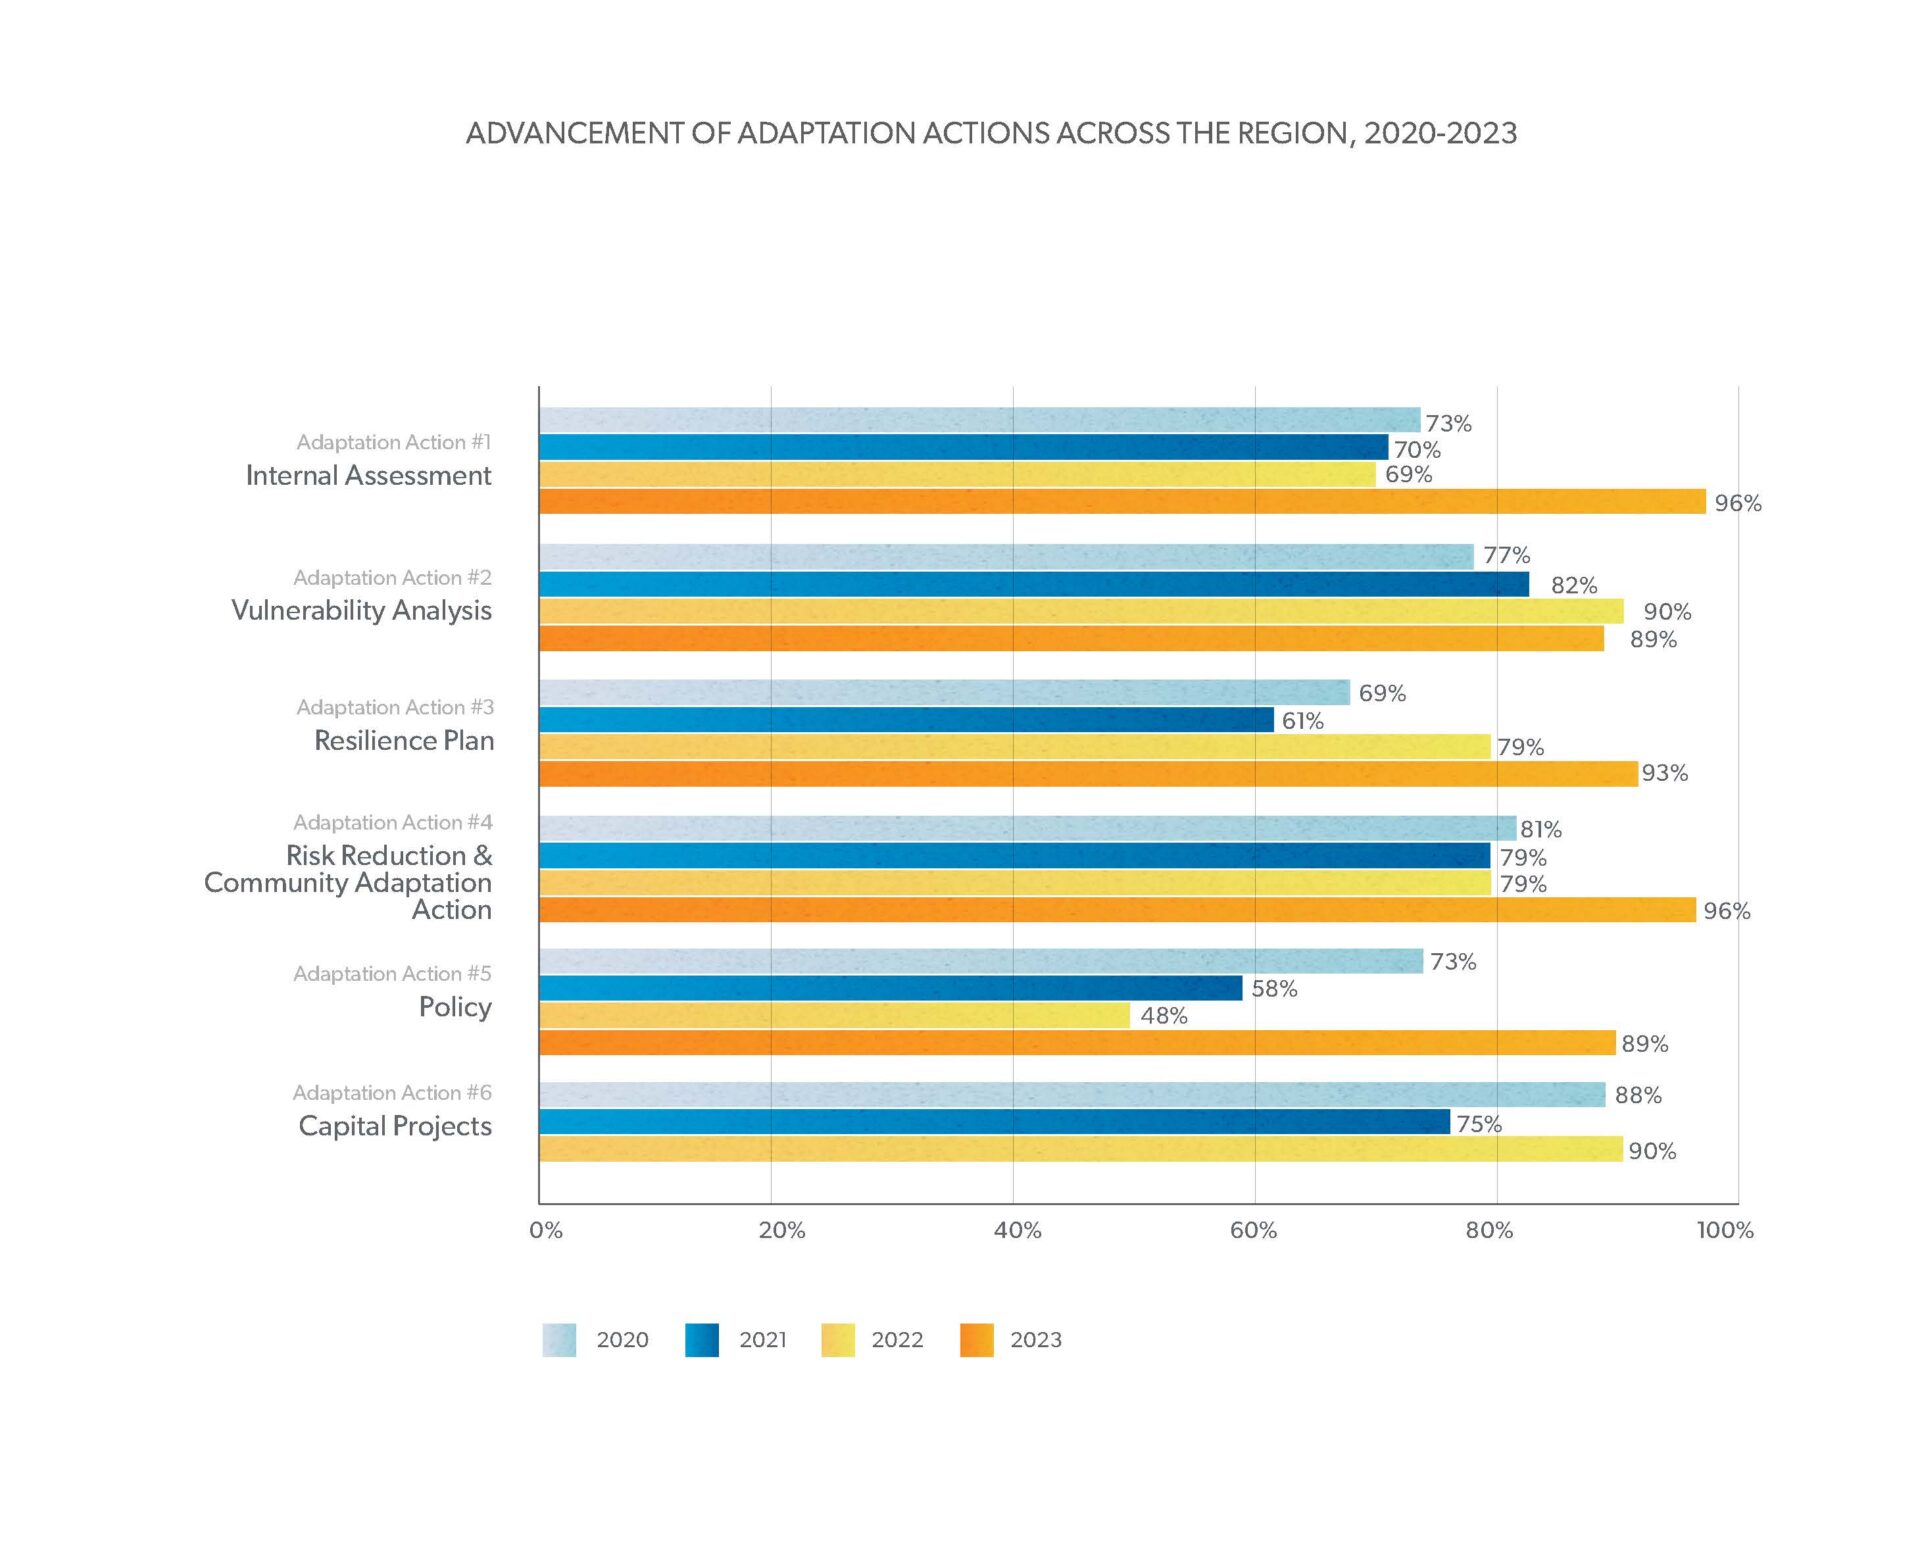
What are the priority actions where local/tribal governments are making the most progress?
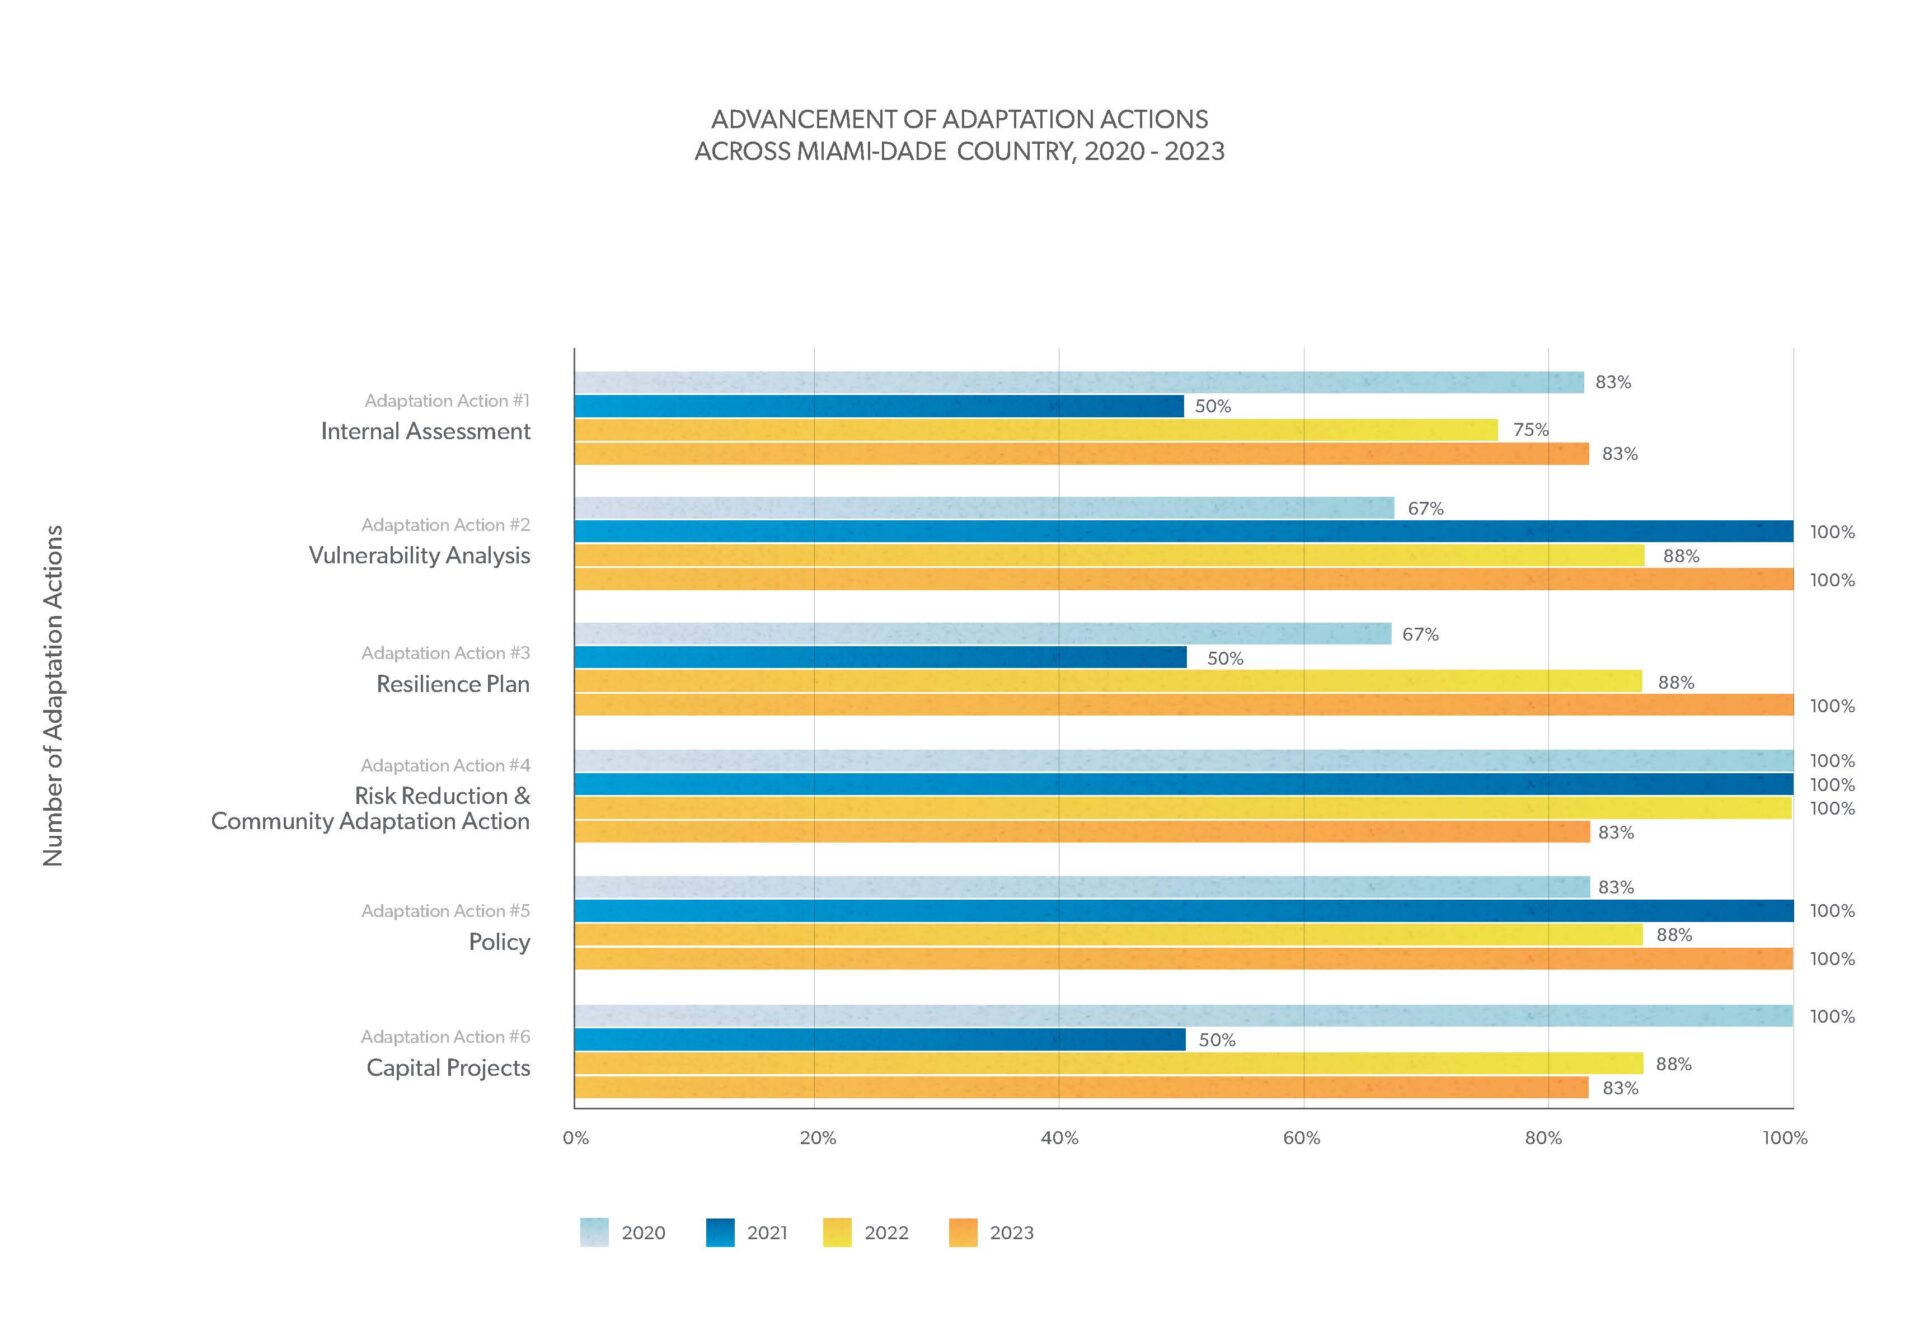
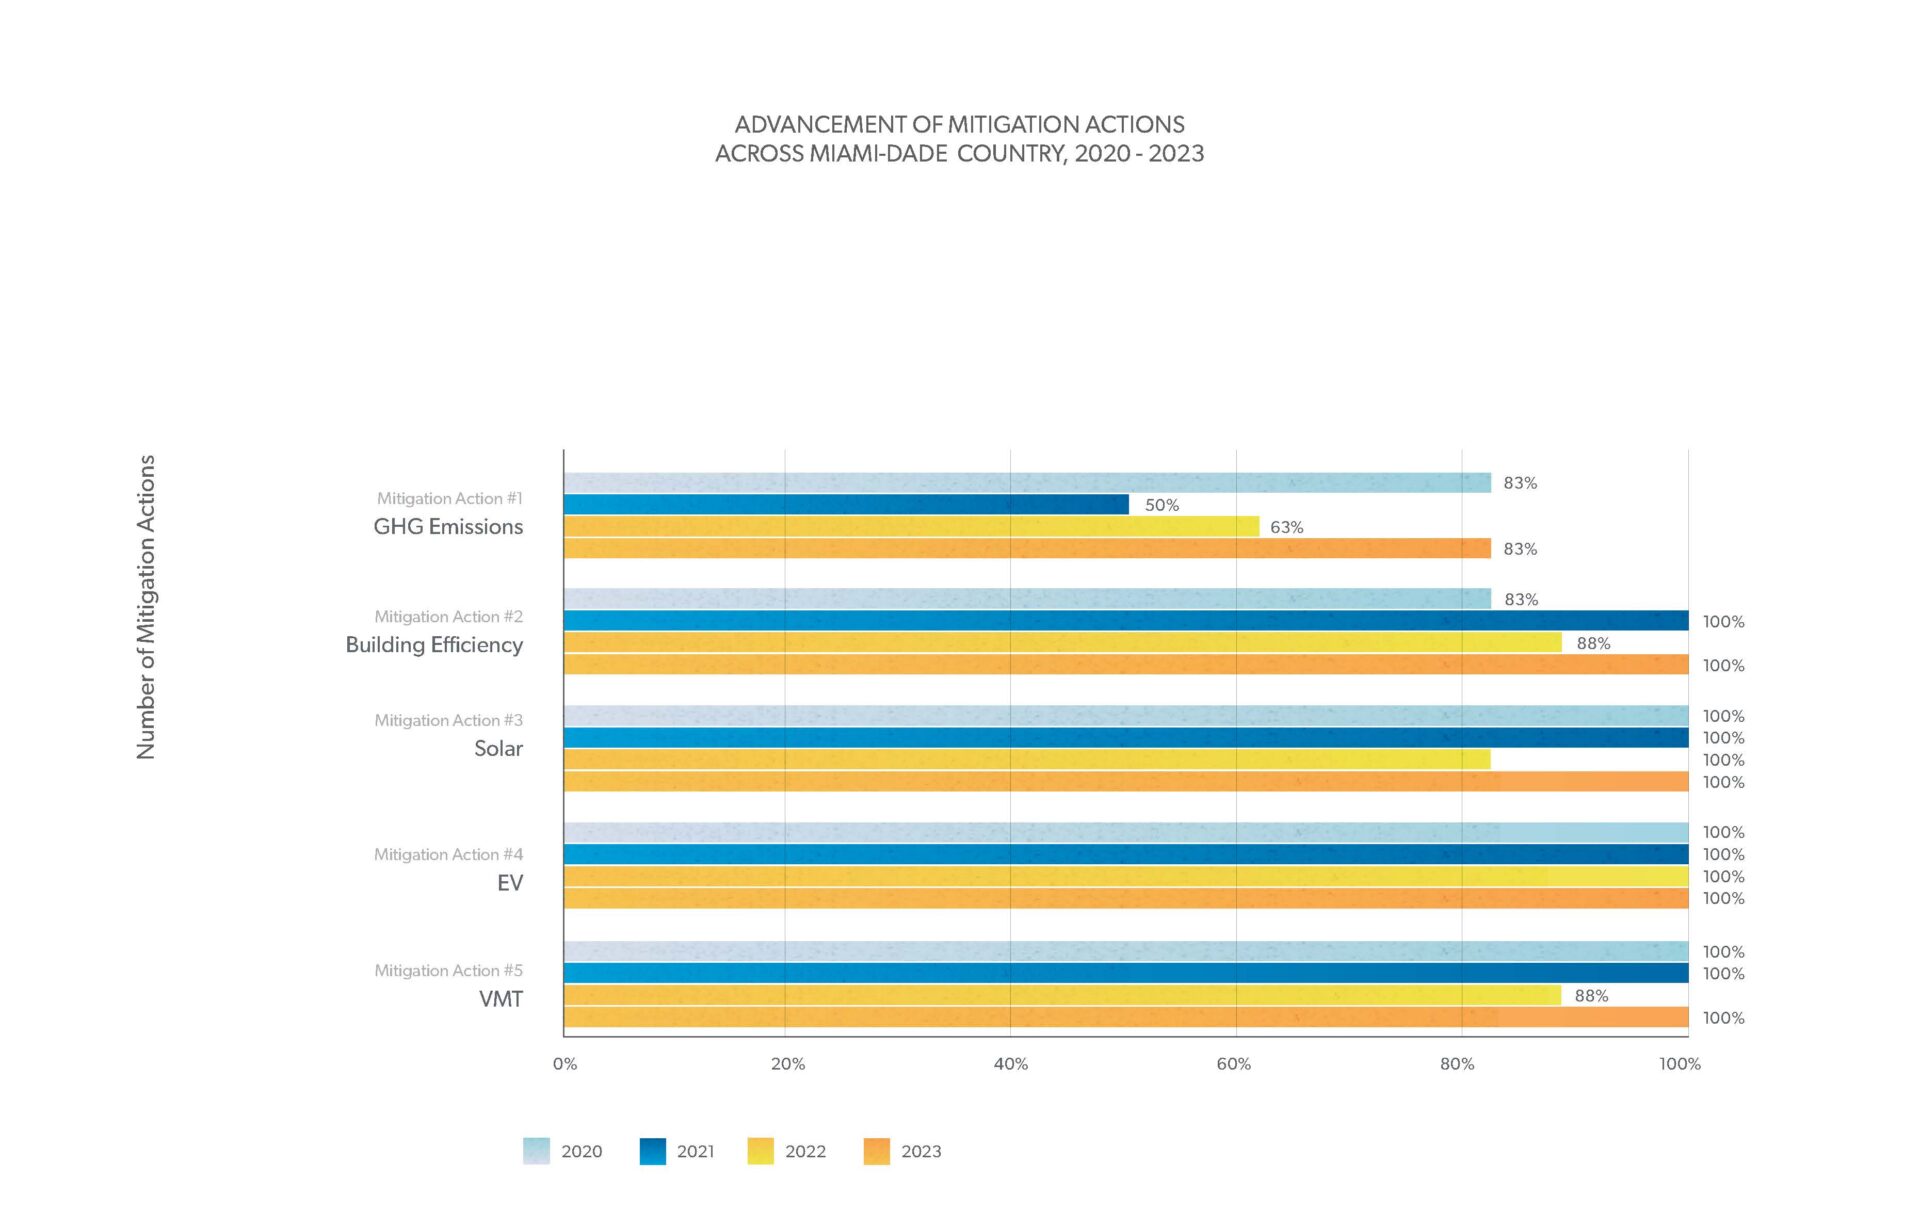
Related to mitigation priorities, responding local/tribal governments are making the most progress on the use and adoption of solar energy (96%). Related to adaptation priorities, responding local/tribal governments are making the most progress in conducting internal assessments of capacity advance initiatives (96%) and advancing risk reduction and community planning (96%).
County Snapshot
Broward County
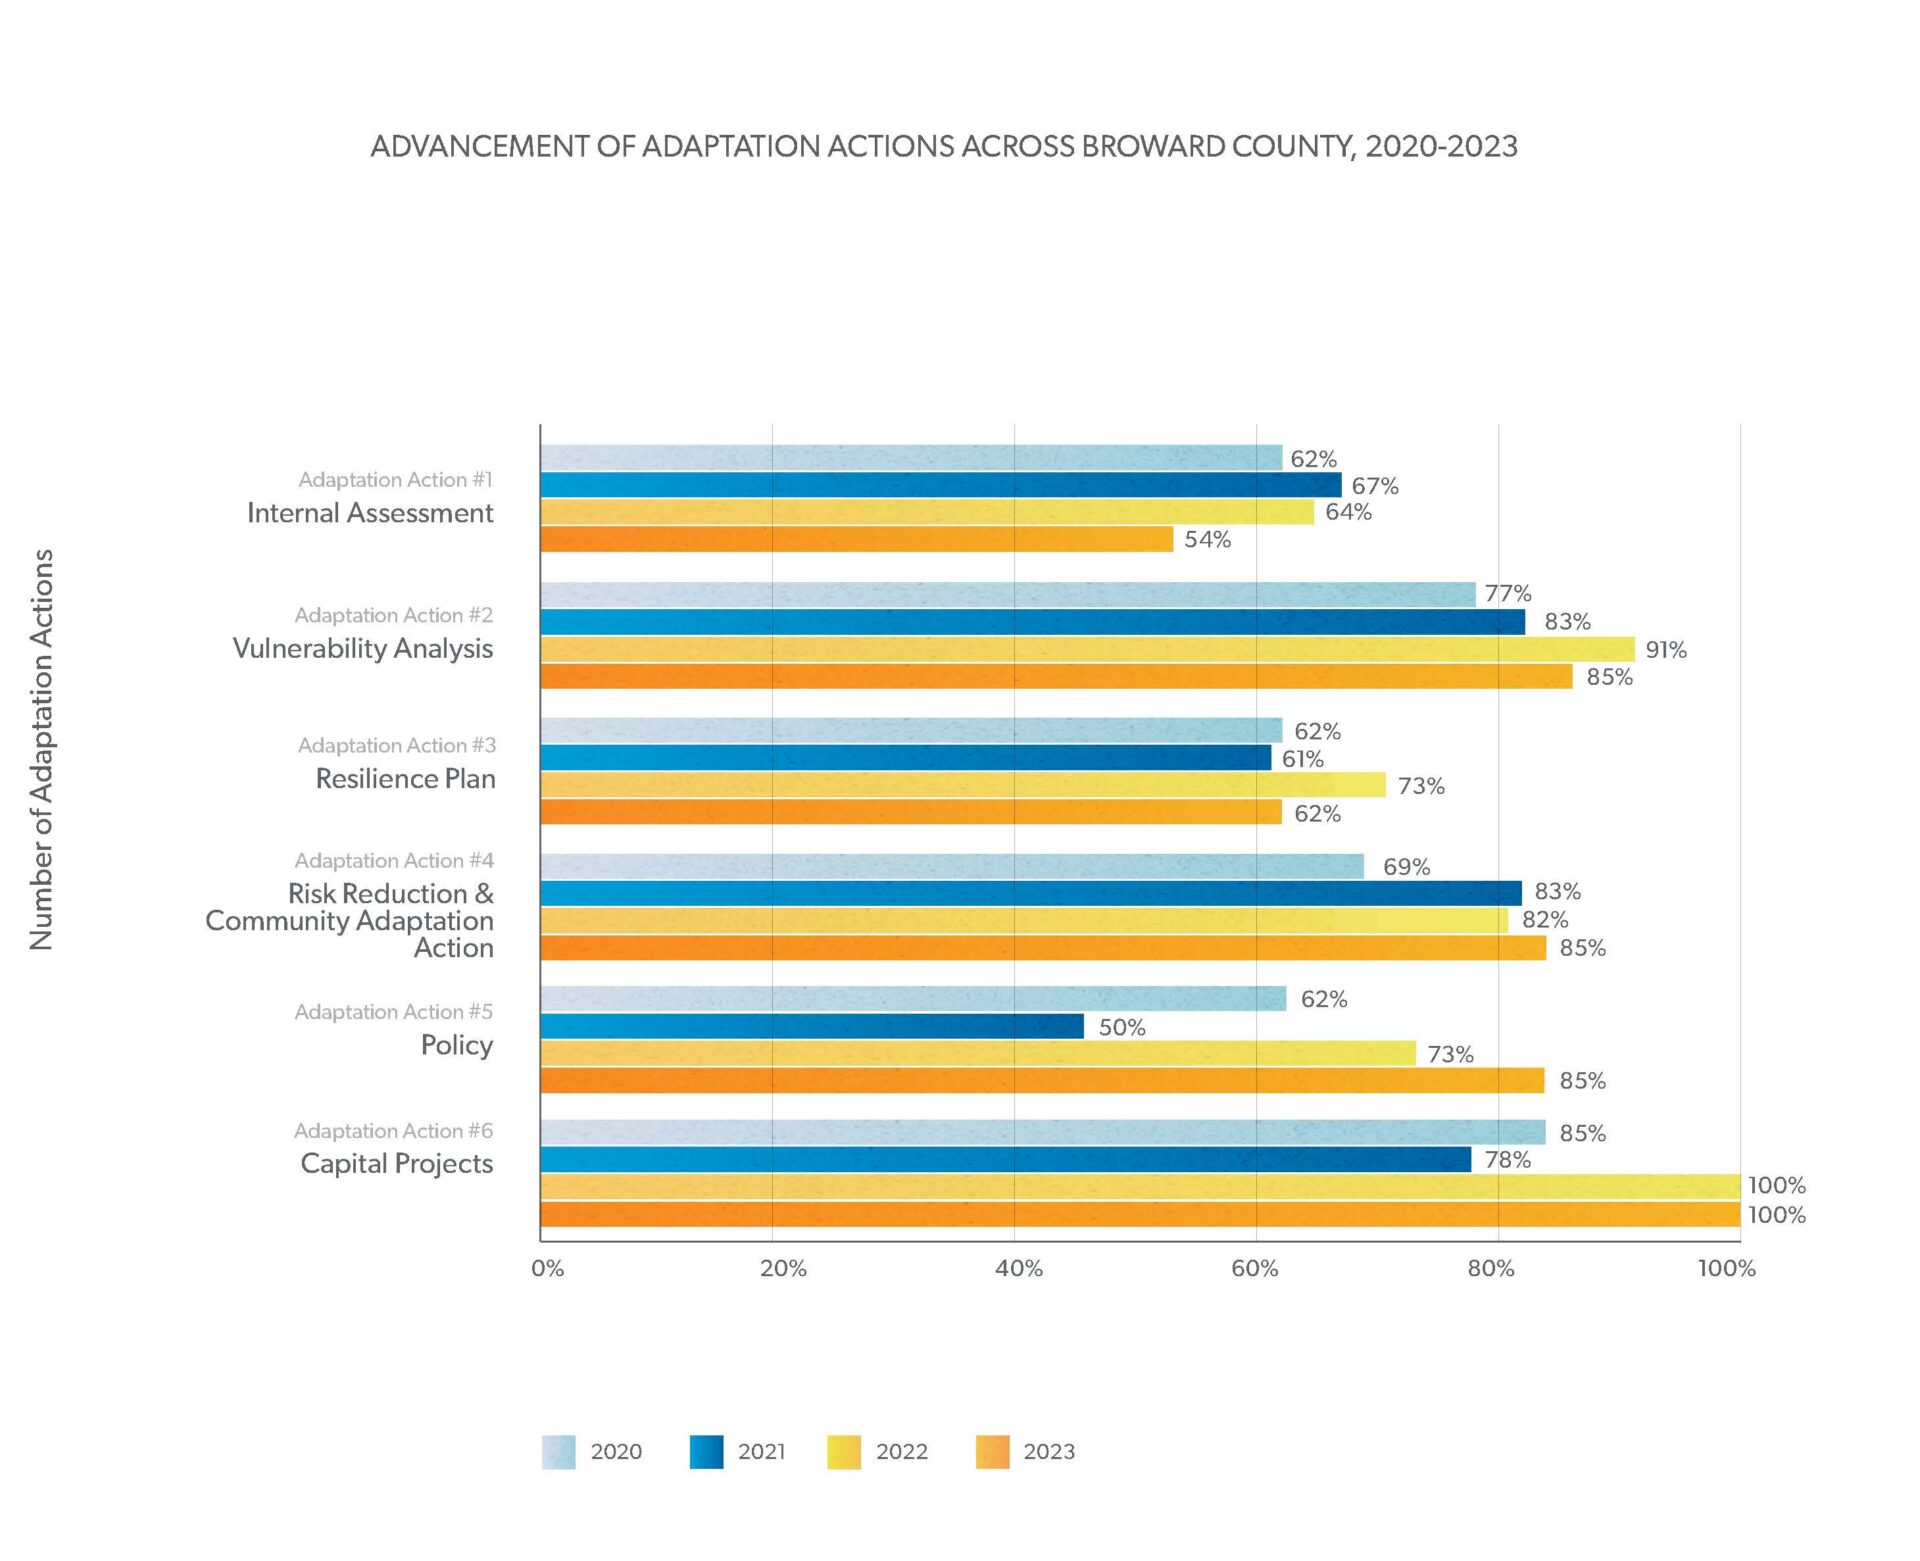
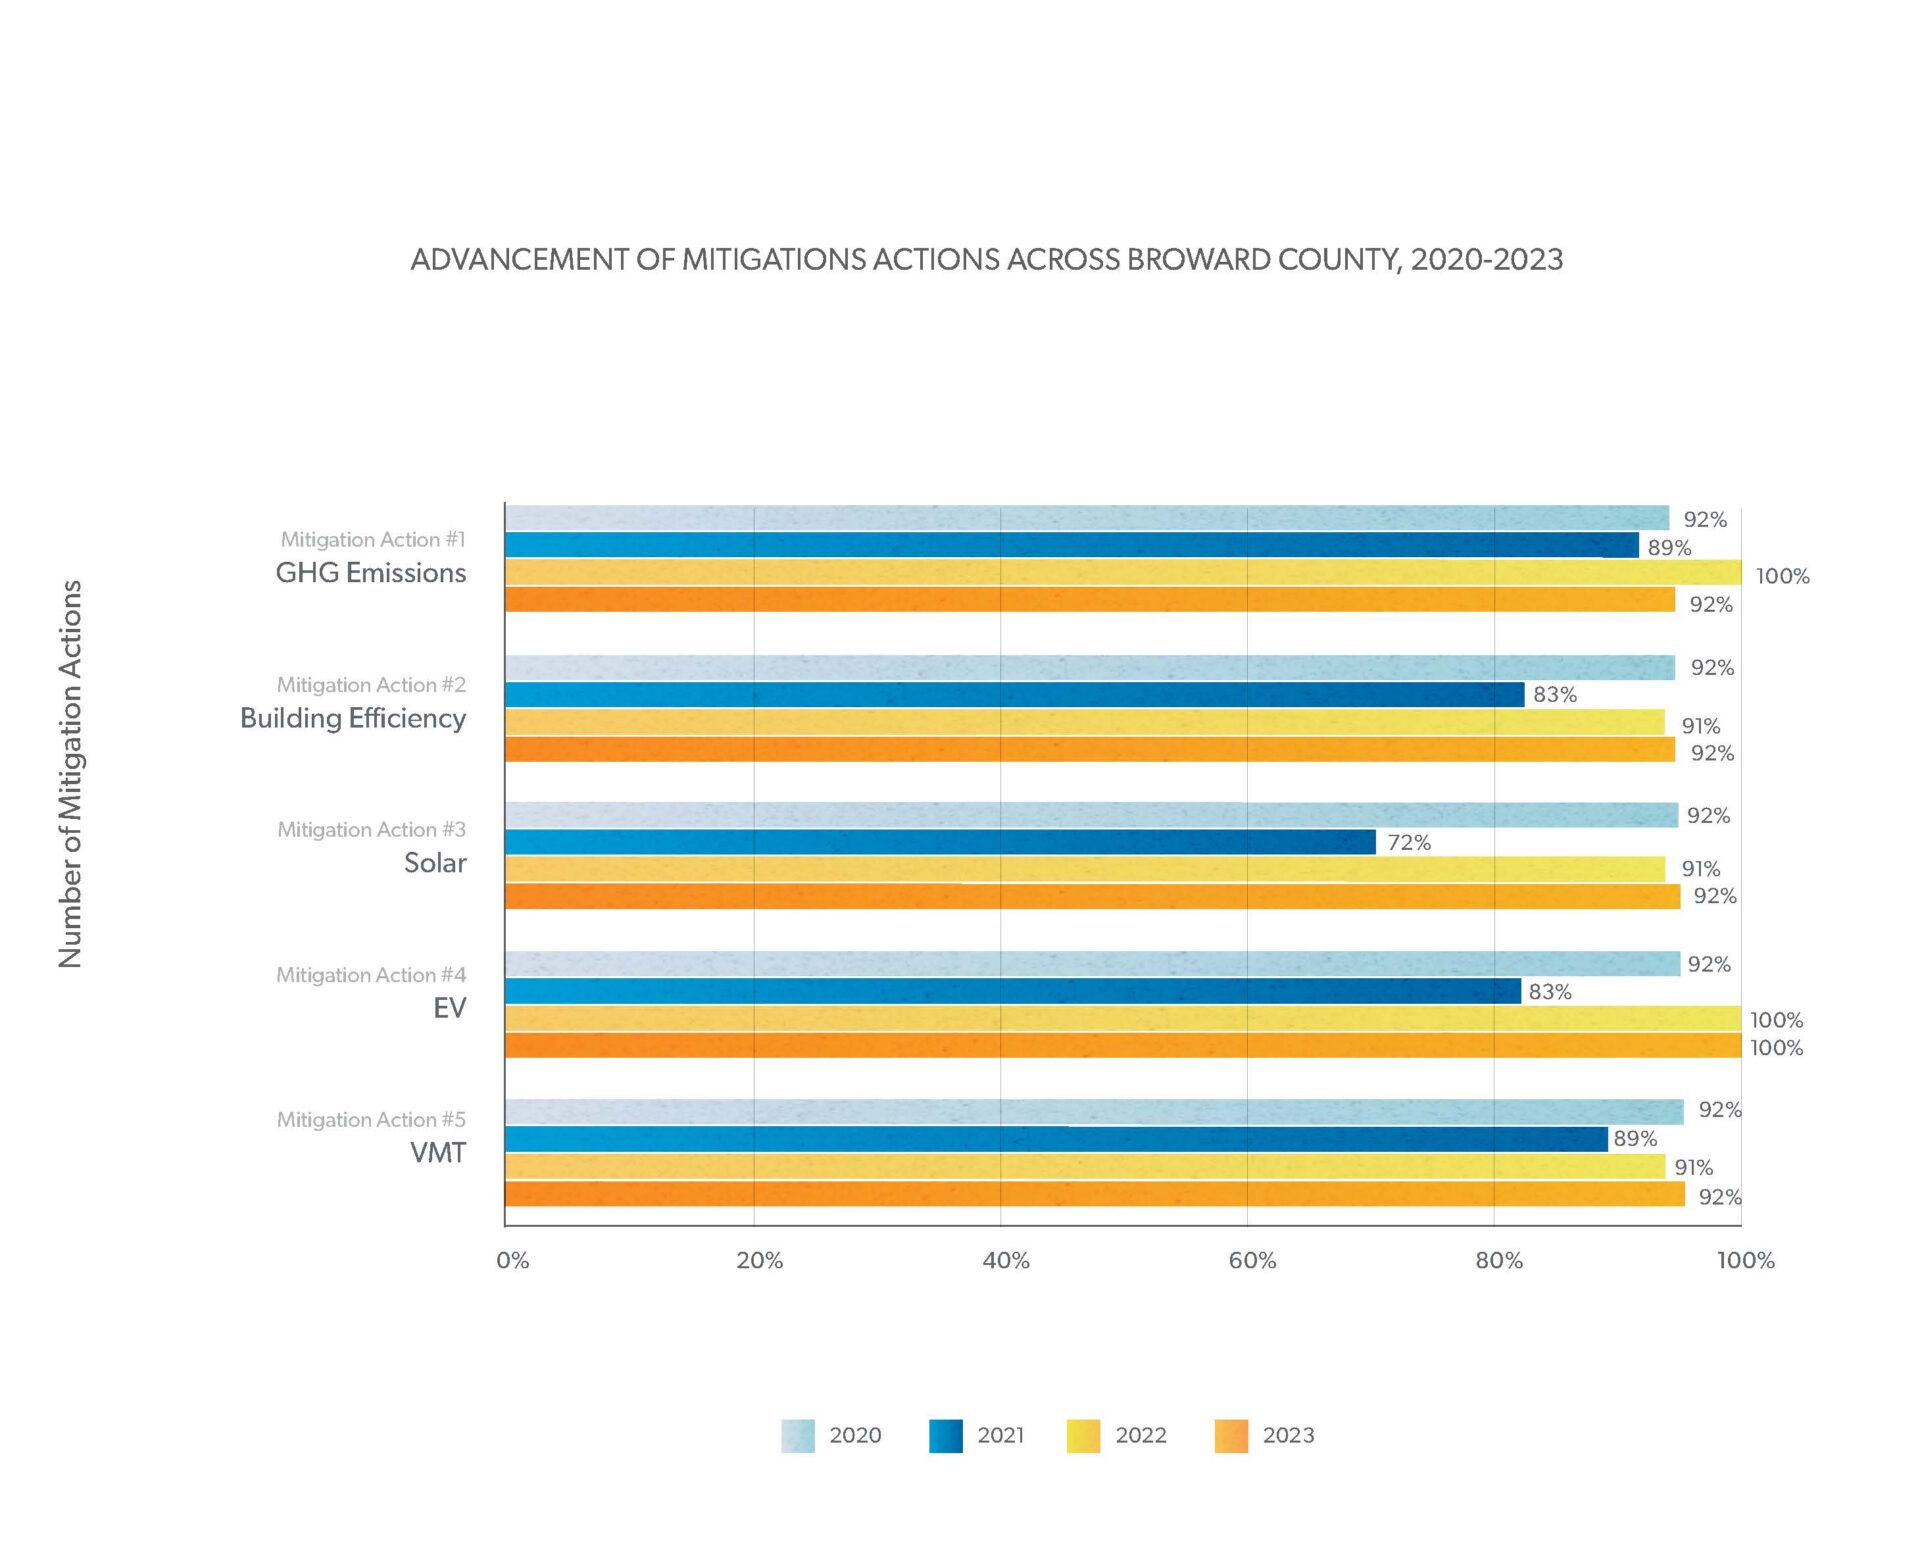
There are 33 local and tribal governments in Broward County, inclusive of the county itself. Thirteen local/tribal governments, including Broward County (39%), responded to the survey, a 6% increase in participation from the prior year. Among respondents in Broward County, 92% are advancing all five priority mitigation actions and 77% are advancing all six priority adaptation actions.
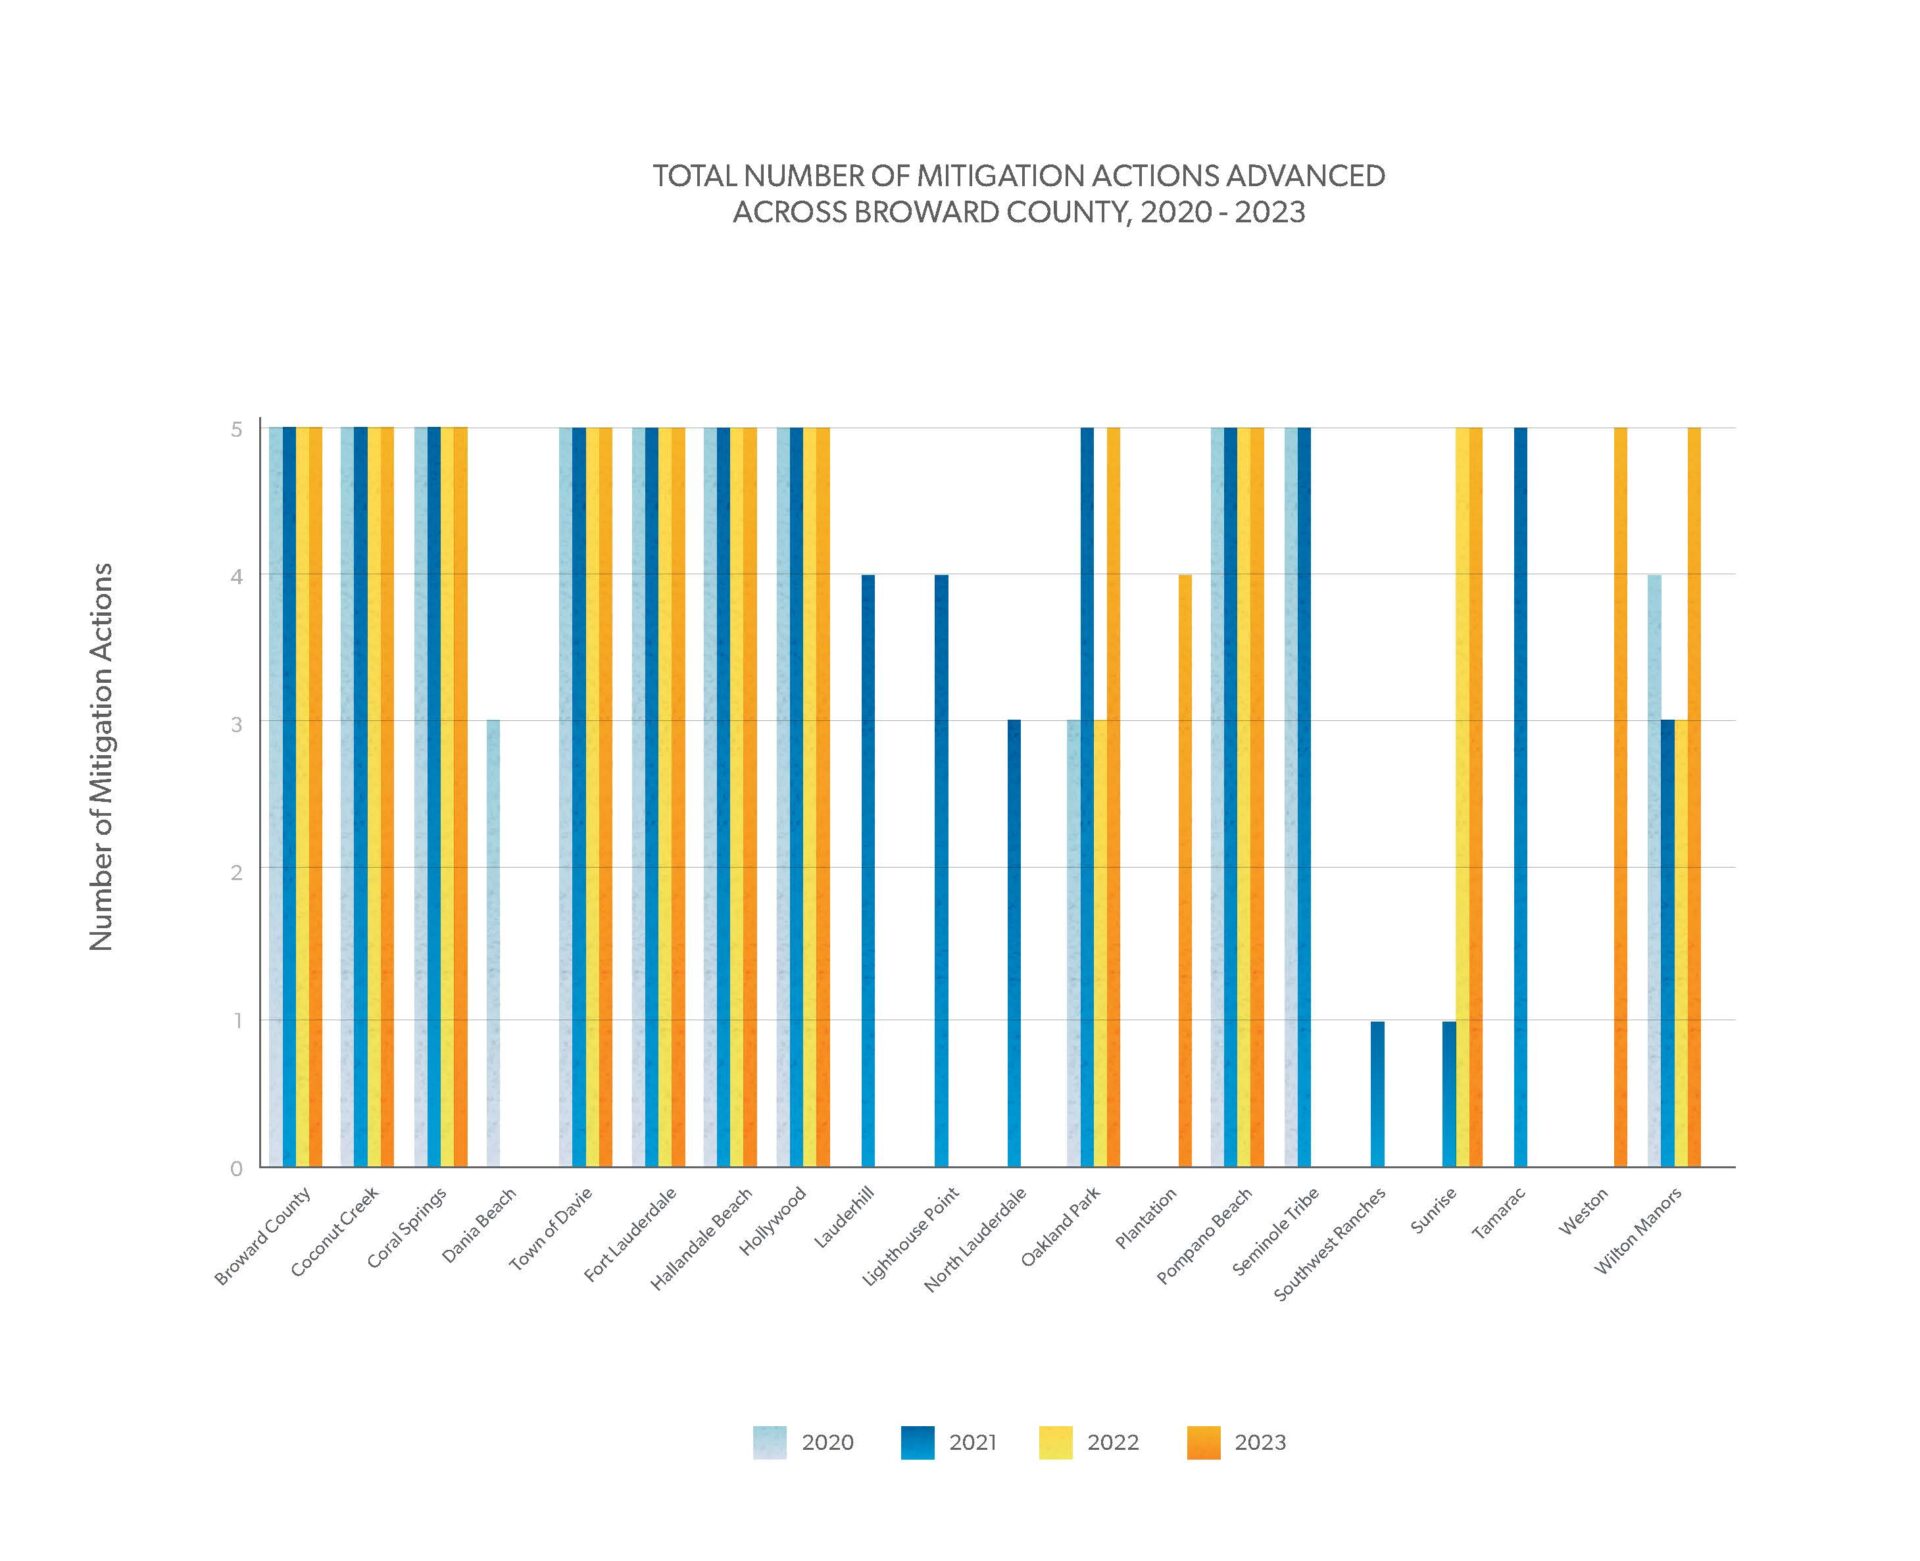
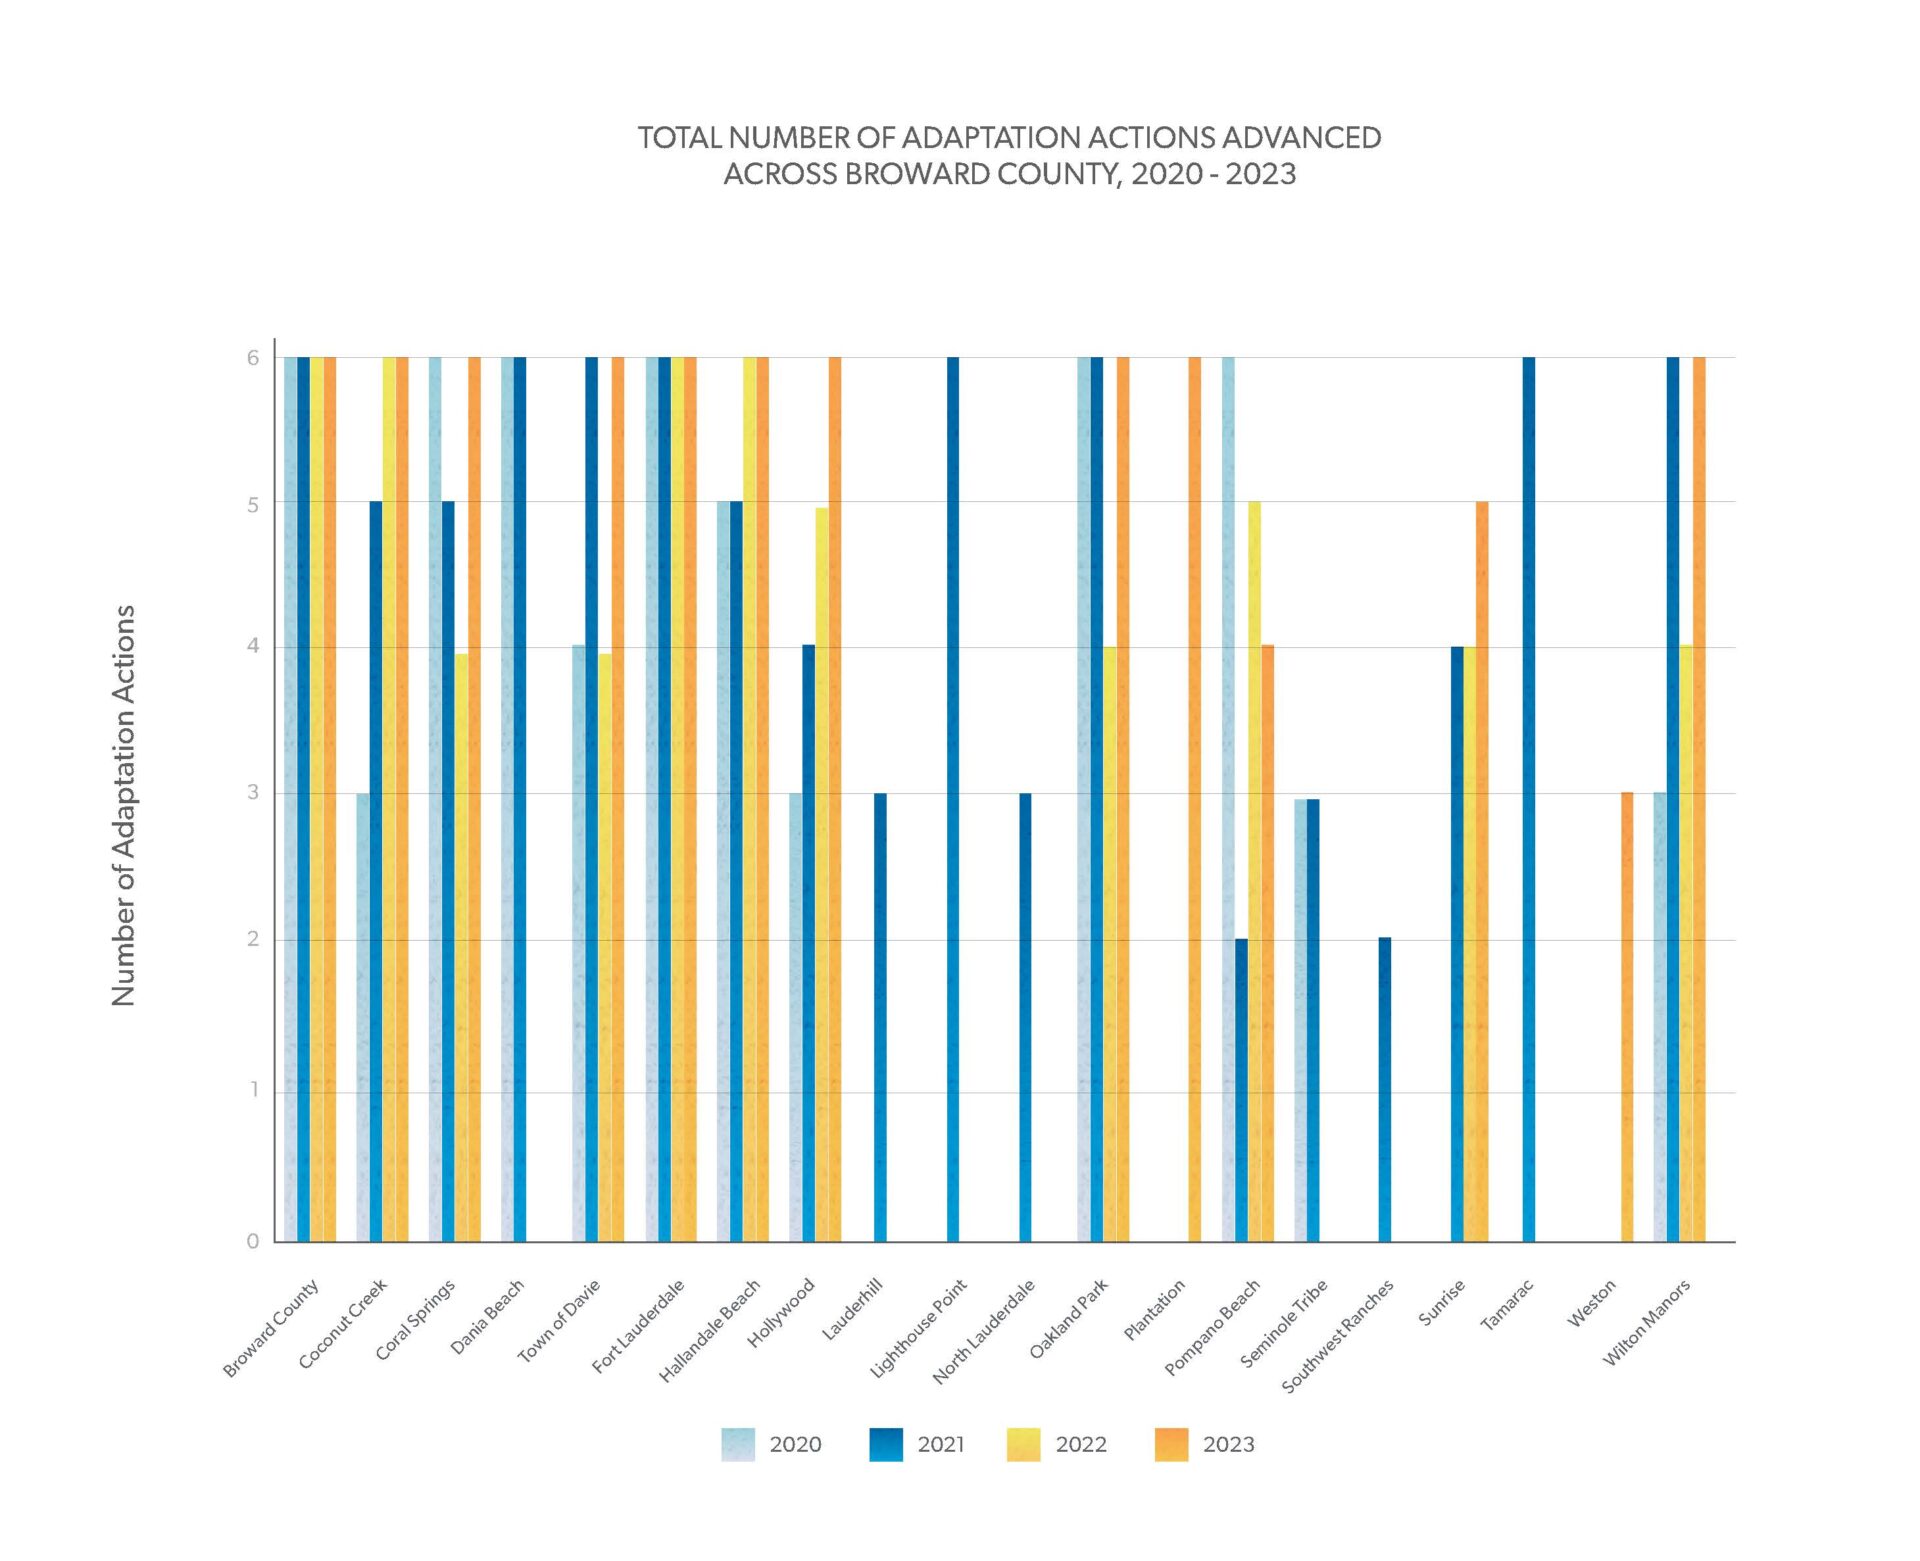
Related to mitigation priorities, respondents in Broward County are making the most progress on electric vehicles (EVs) and the installation of EV infrastructure with 100% of respondents indicating they are advancing these priorities. Related to adaptation priorities, 100% of respondents continue to advance capital projects, similar to the prior year.
Miami-Dade County
There are 36 local and tribal governments in Miami-Dade County, inclusive of the county itself. Six local governments responded to this year’s survey, a 6% decrease in participation from the previous year. Among respondents in Miami-Dade County, 83% of respondents are advancing all five priority mitigation actions, as well as advancing all six priority adaptation actions.
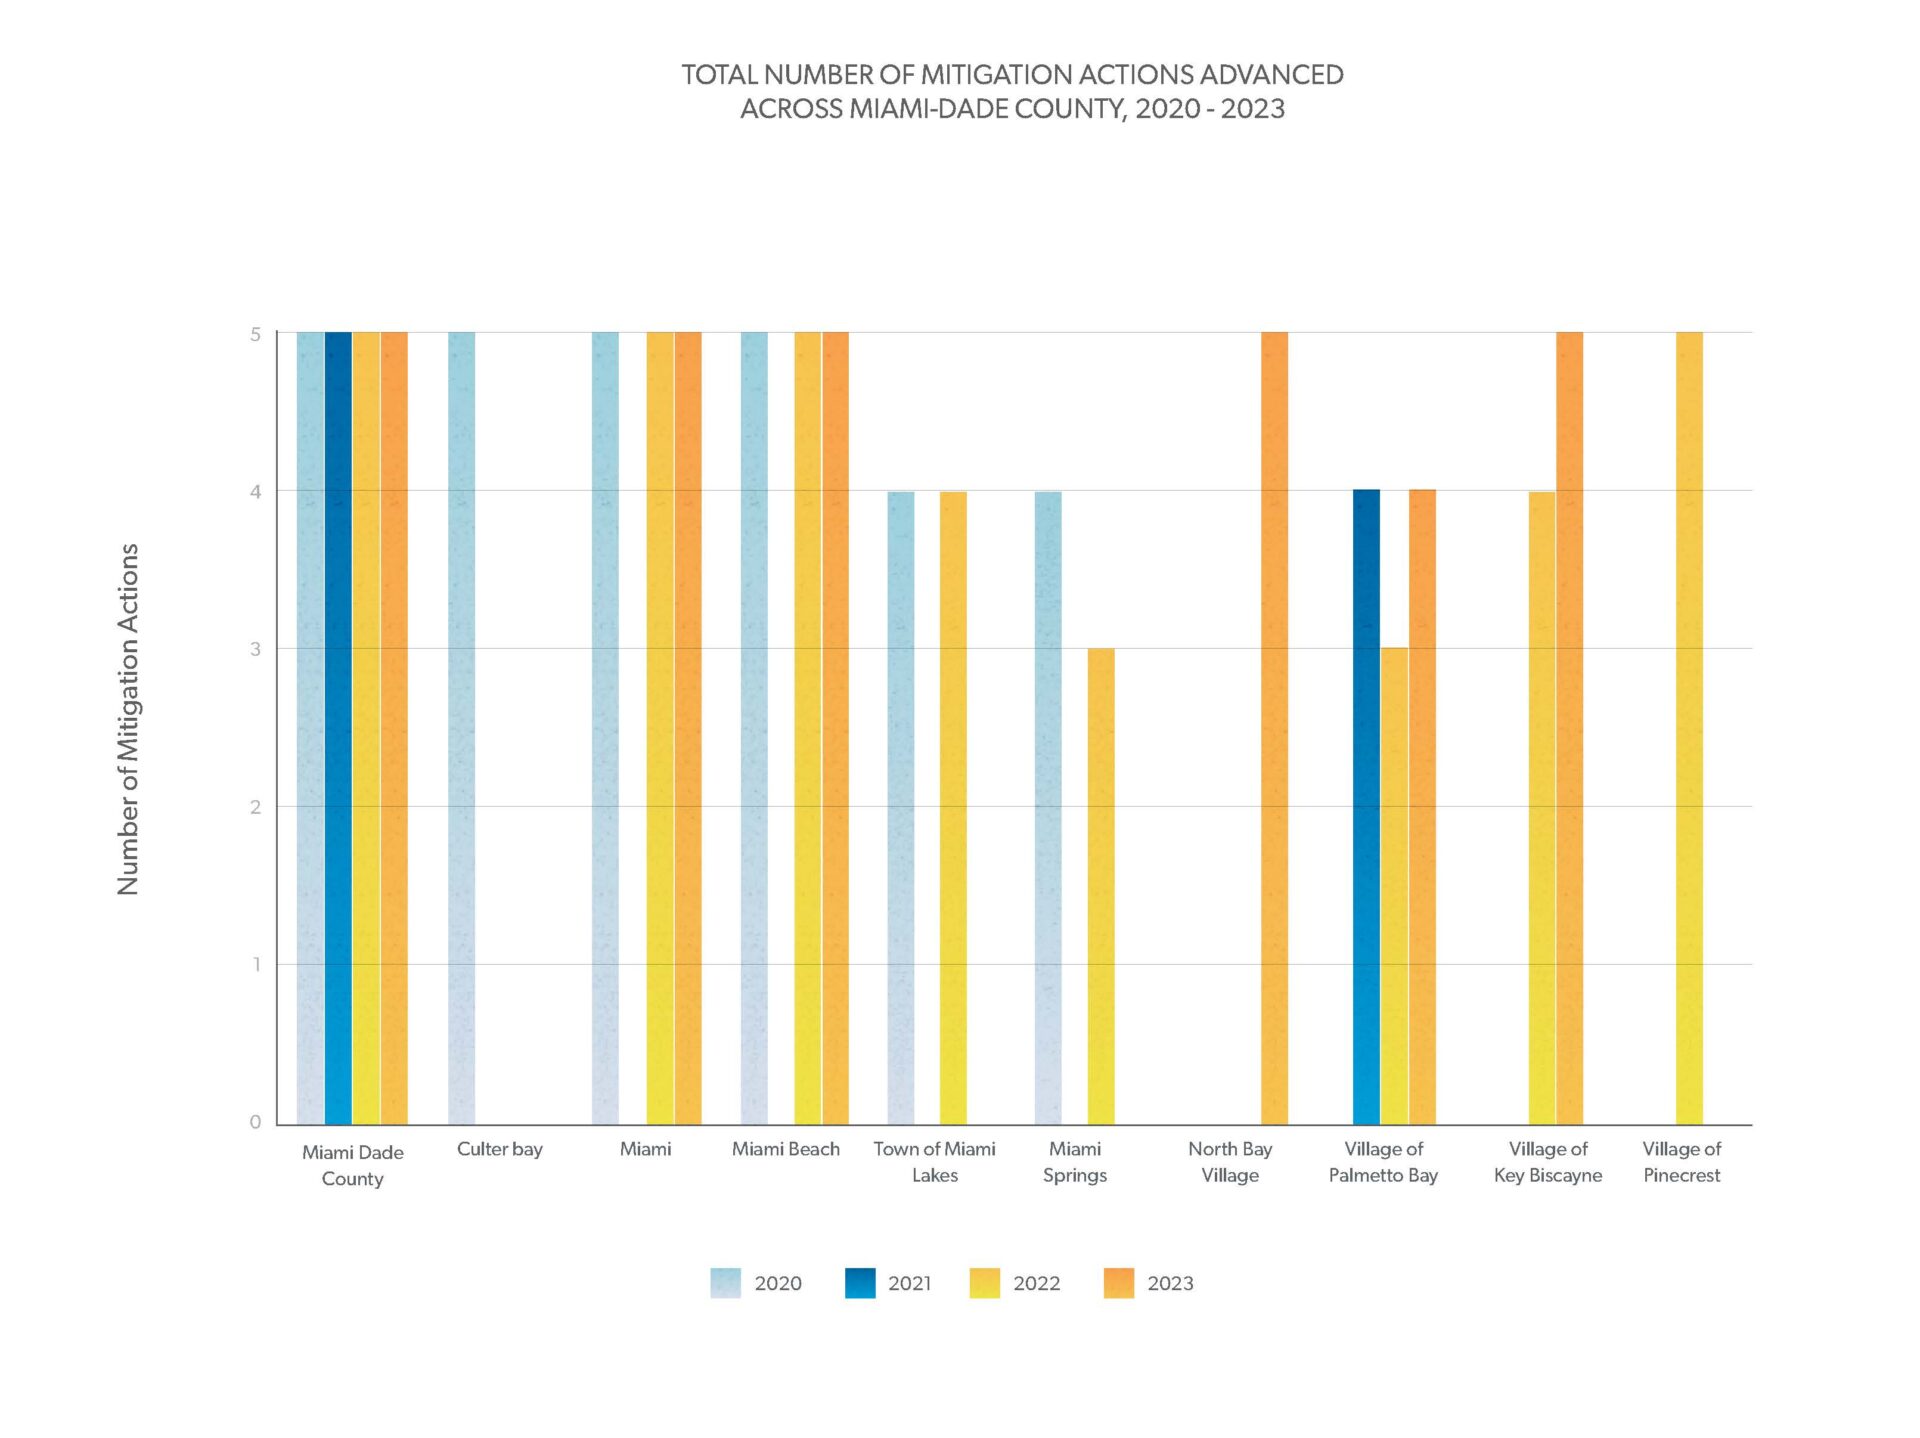
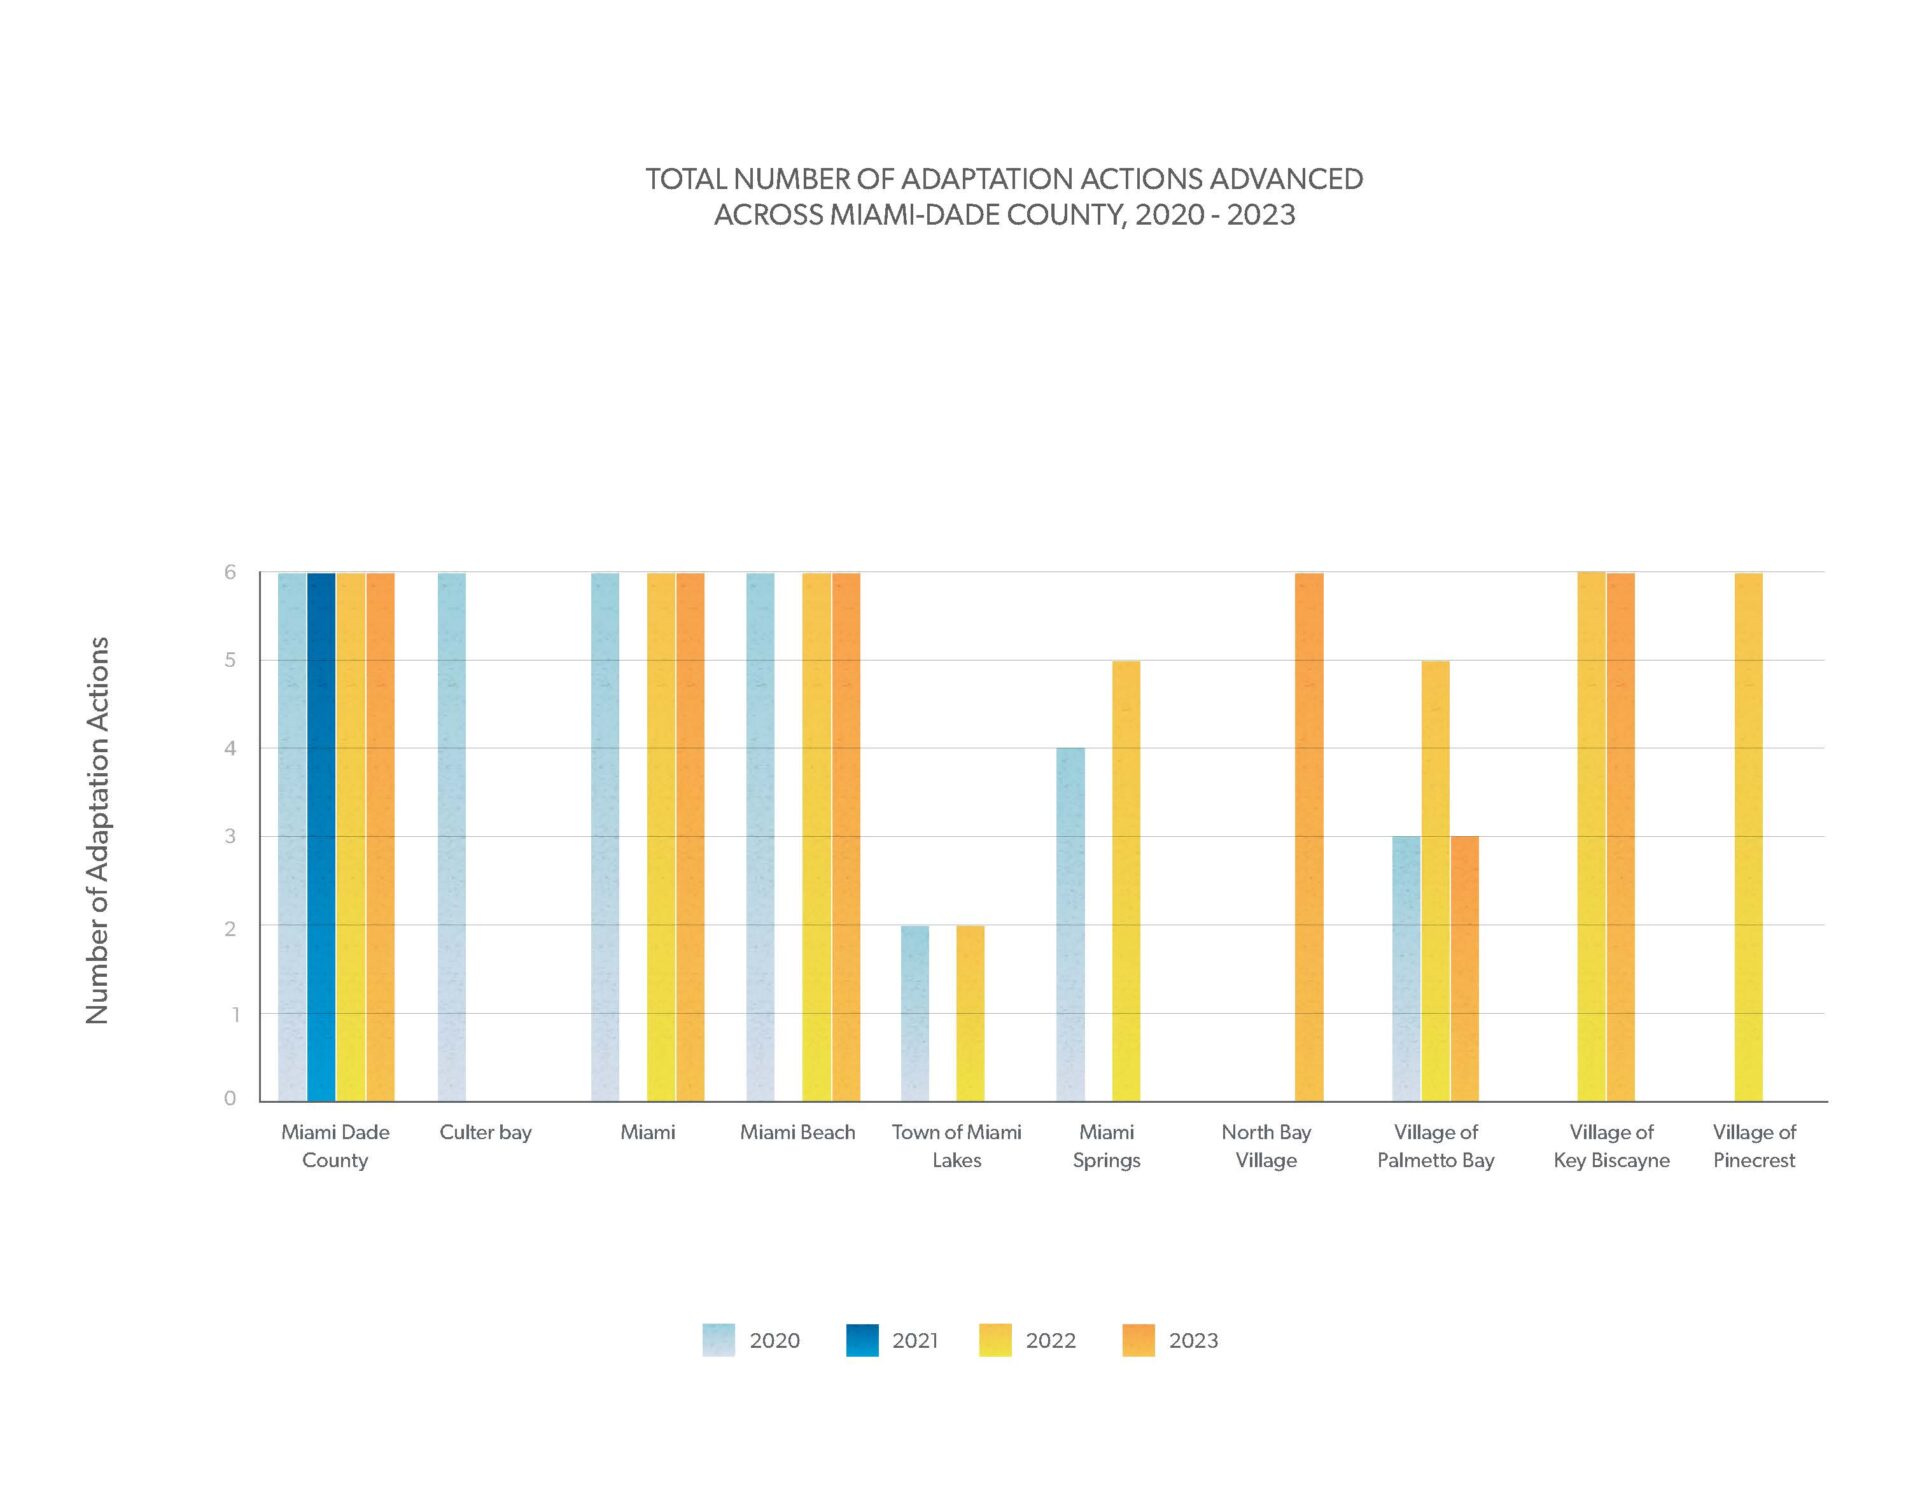
Related to mitigation priorities, respondents in Miami-Dade County made the most progress on energy efficiency, solar, electric vehicles, and vehicle miles traveled, with 100% of respondents indicating they are advancing these priorities. Related to adaptation priorities, the most progress is being made in conducting vulnerability analyses, incorporating risk reduction and community planning, and advancing policies, with 100% of respondents indicating they are advancing these priorities.
Monroe County
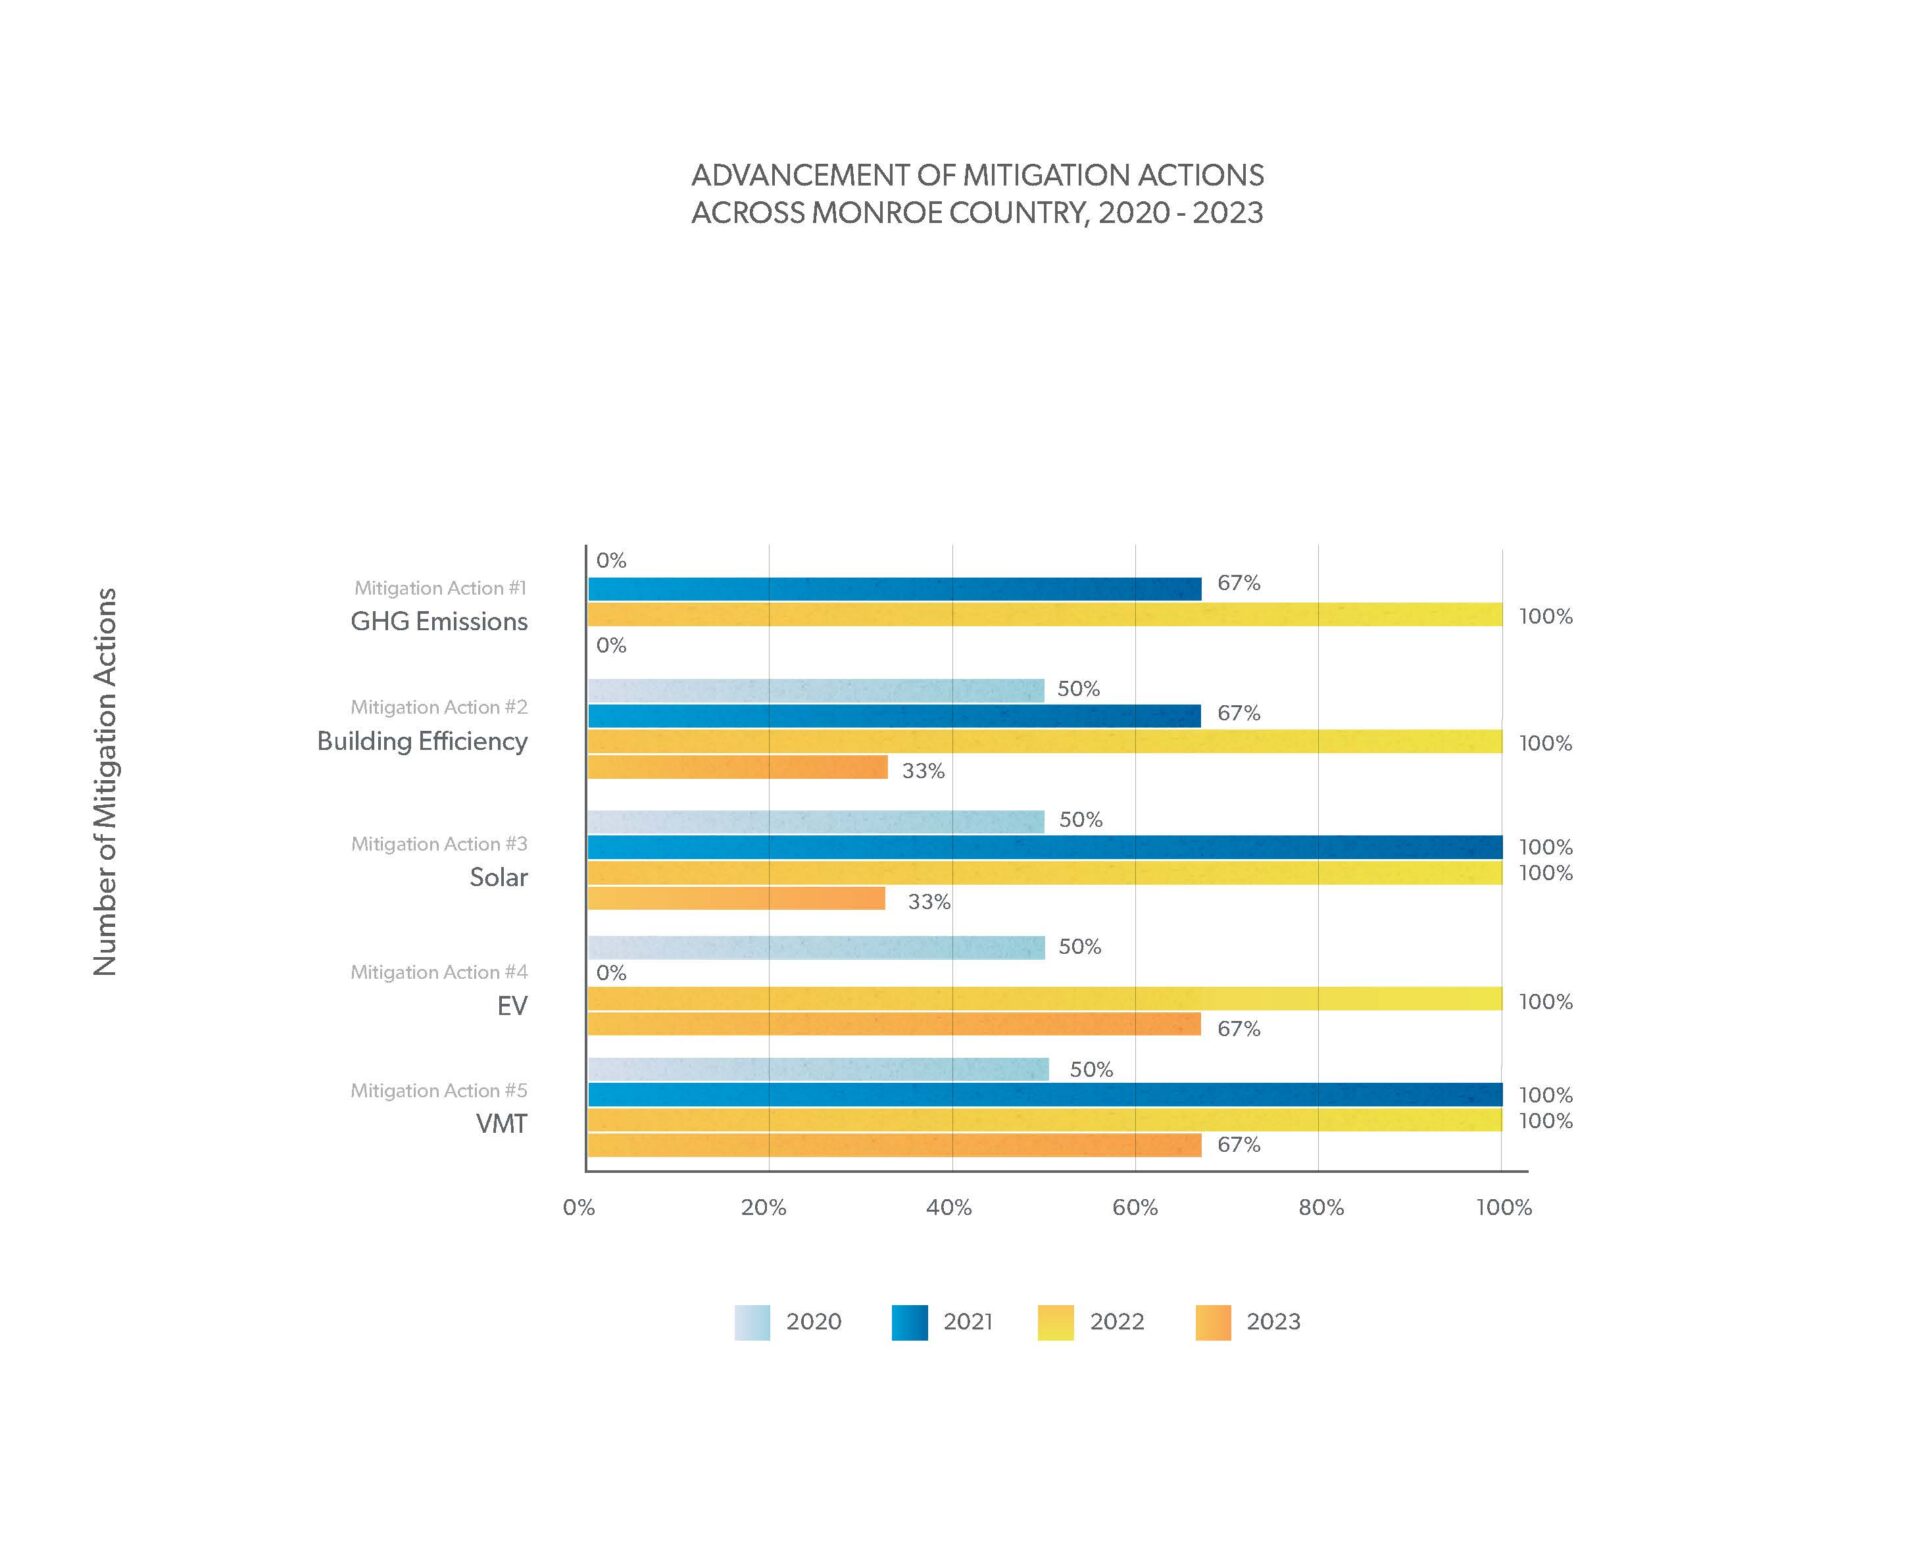
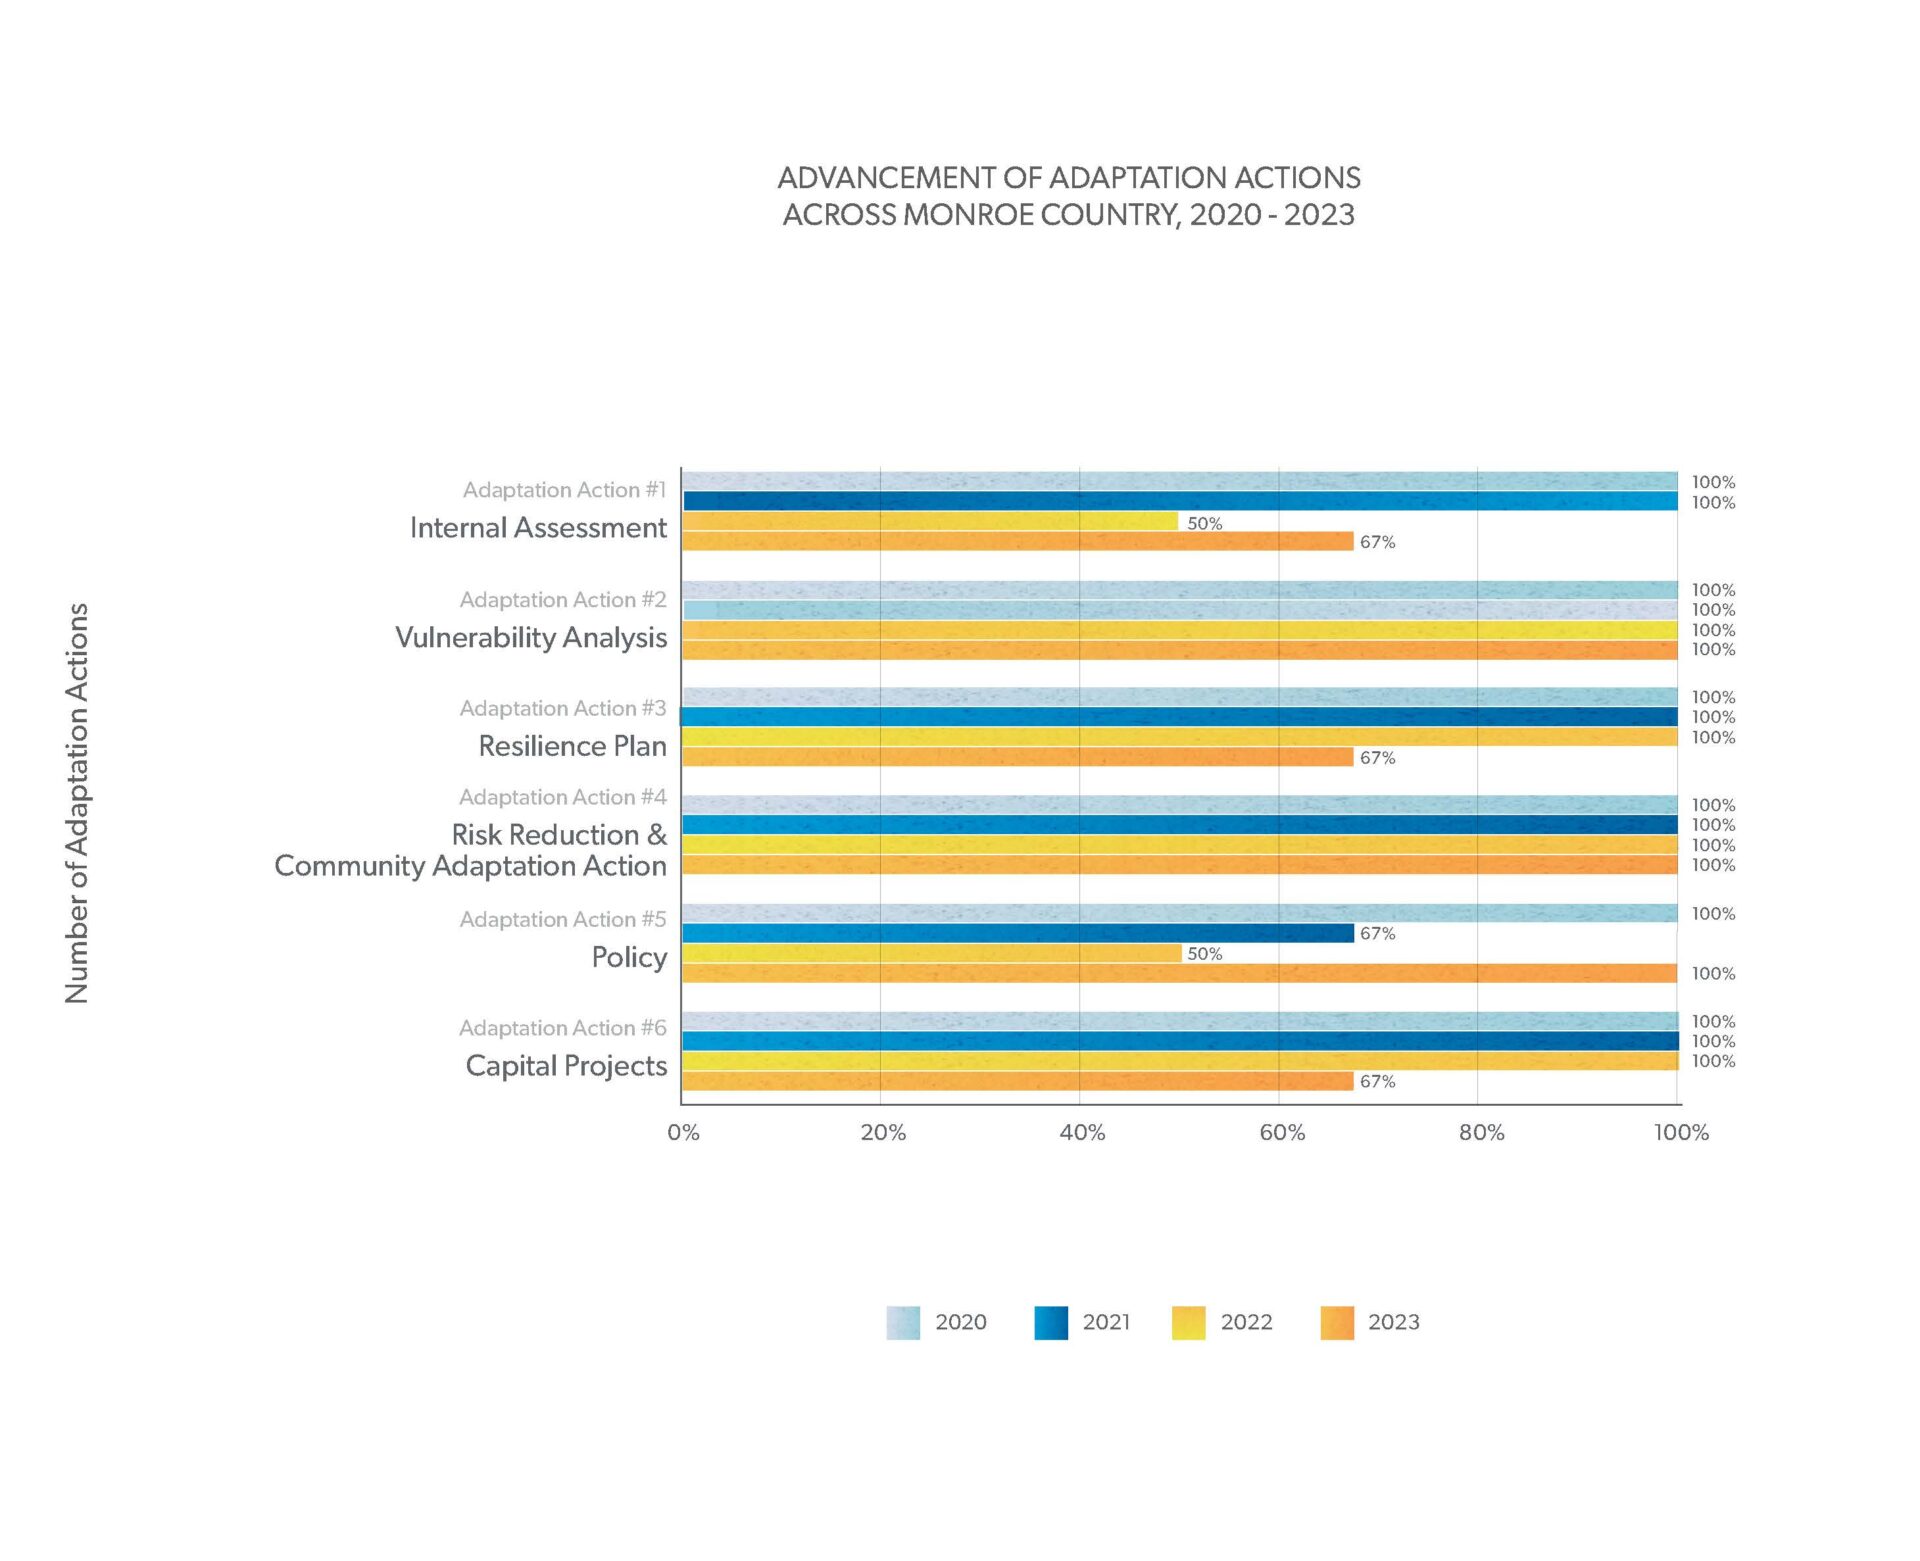
There are six local and tribal governments in Monroe County, inclusive of the county itself. Three local/tribal governments, including Monroe County, responded to the survey, a 17% increase in participation from the prior year. All respondents indicate some advancement in all five priority mitigation actions. Monroe County and Islamorada are advancing all six priority adaptation actions.
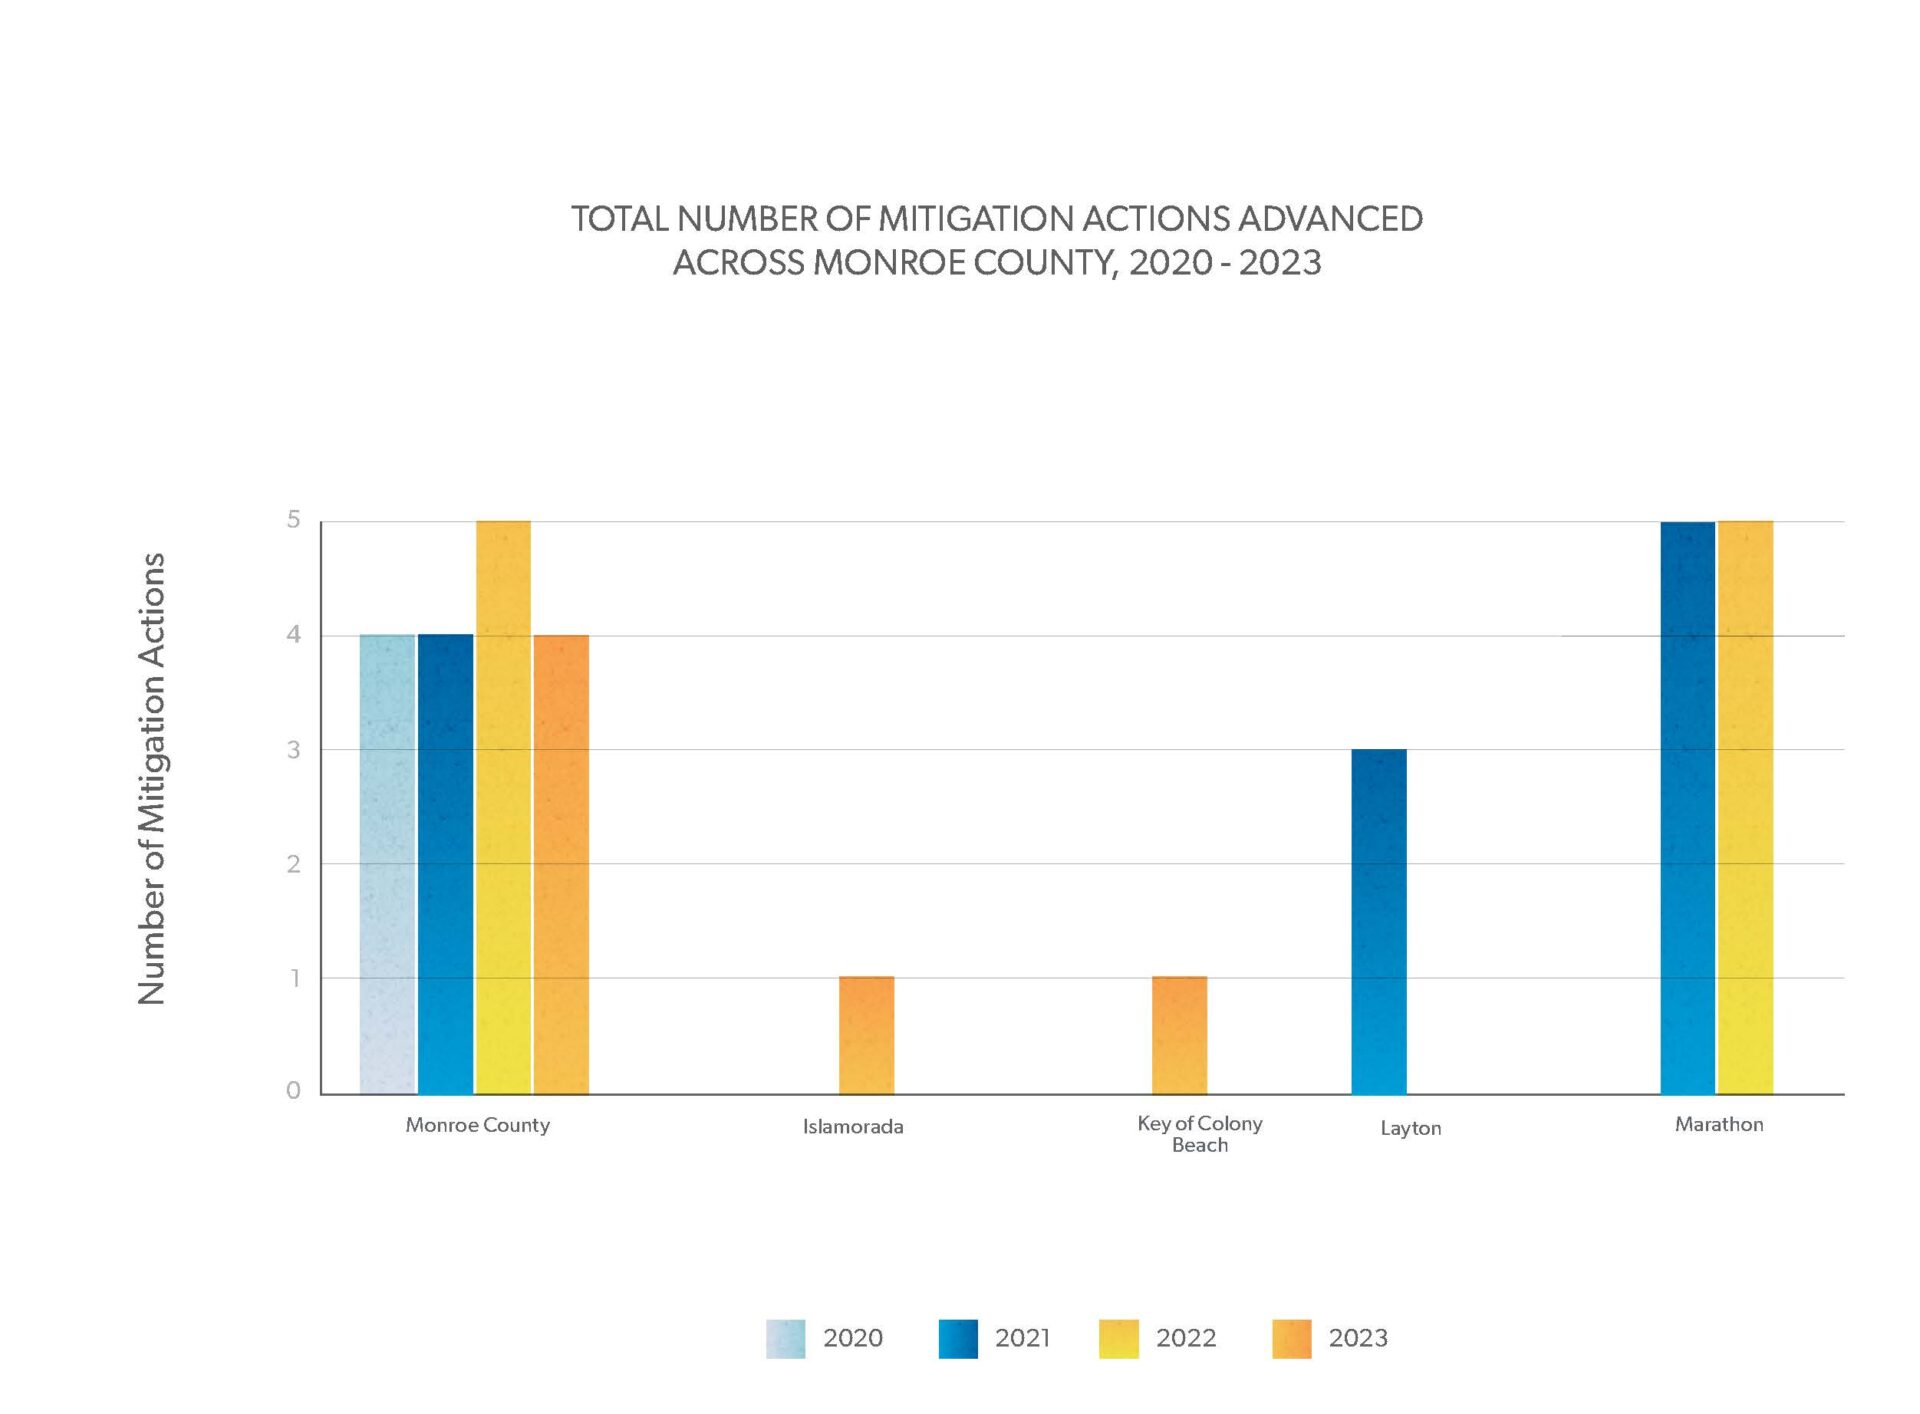
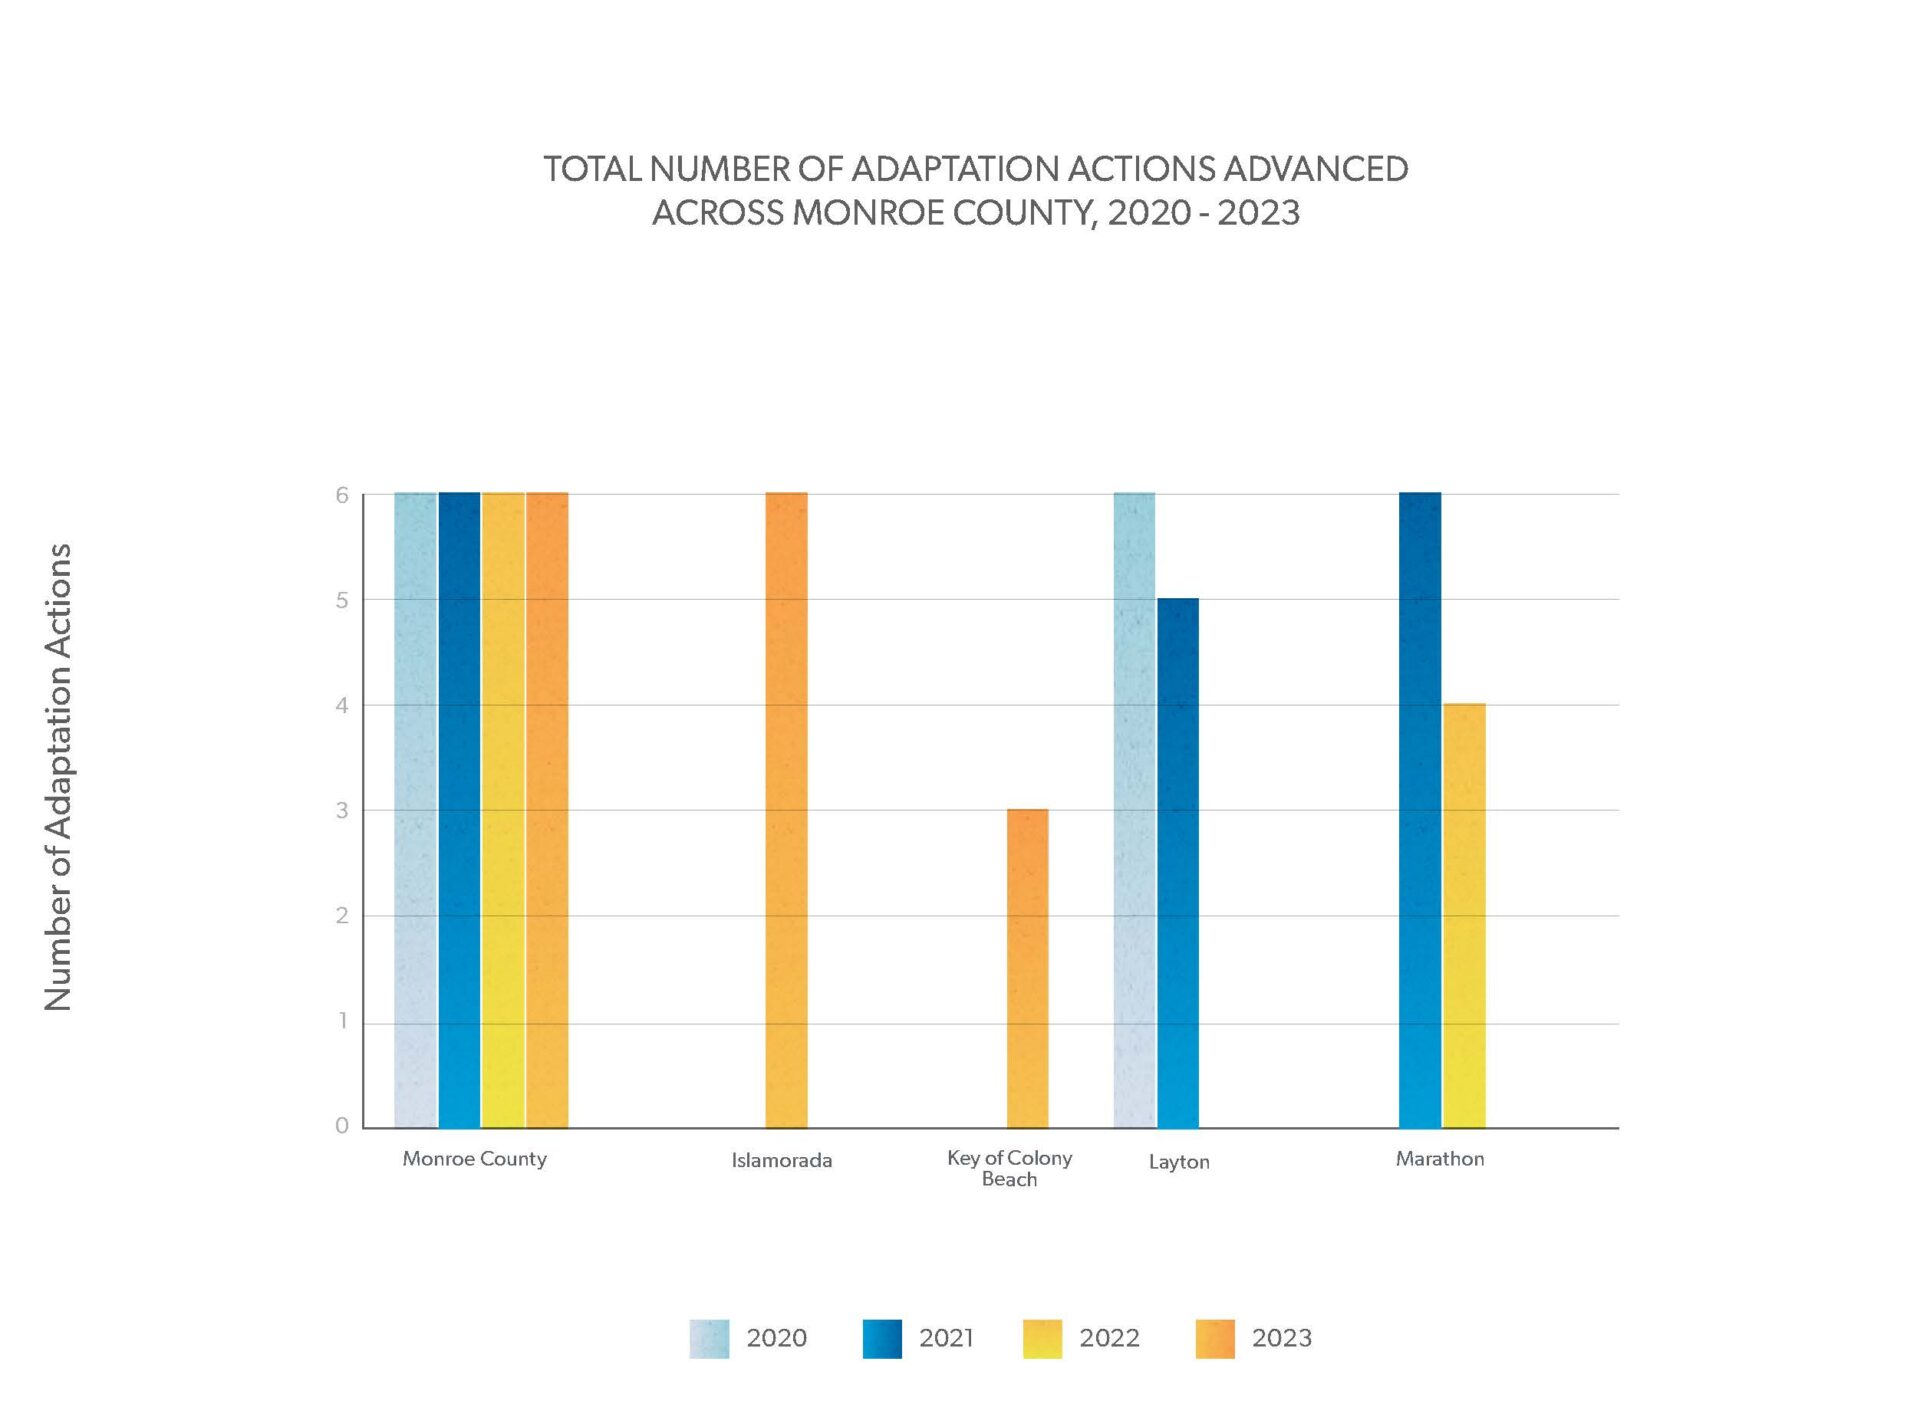
Mitigation actions related to electric vehicles and reducing vehicle miles traveled are being advanced by 67% of respondents. Three of the six priority adaptation actions are being advanced by all respondents.
Palm Beach County
There are 40 local and tribal governments in Palm Beach County, inclusive of the county itself. Five local/tribal governments, including Palm Beach County, responded to the survey, an 8% decrease in participation from the prior year. Among respondents in Palm Beach County, 80% are advancing all five priority mitigation actions and 40% are advancing all six priority adaptation actions.

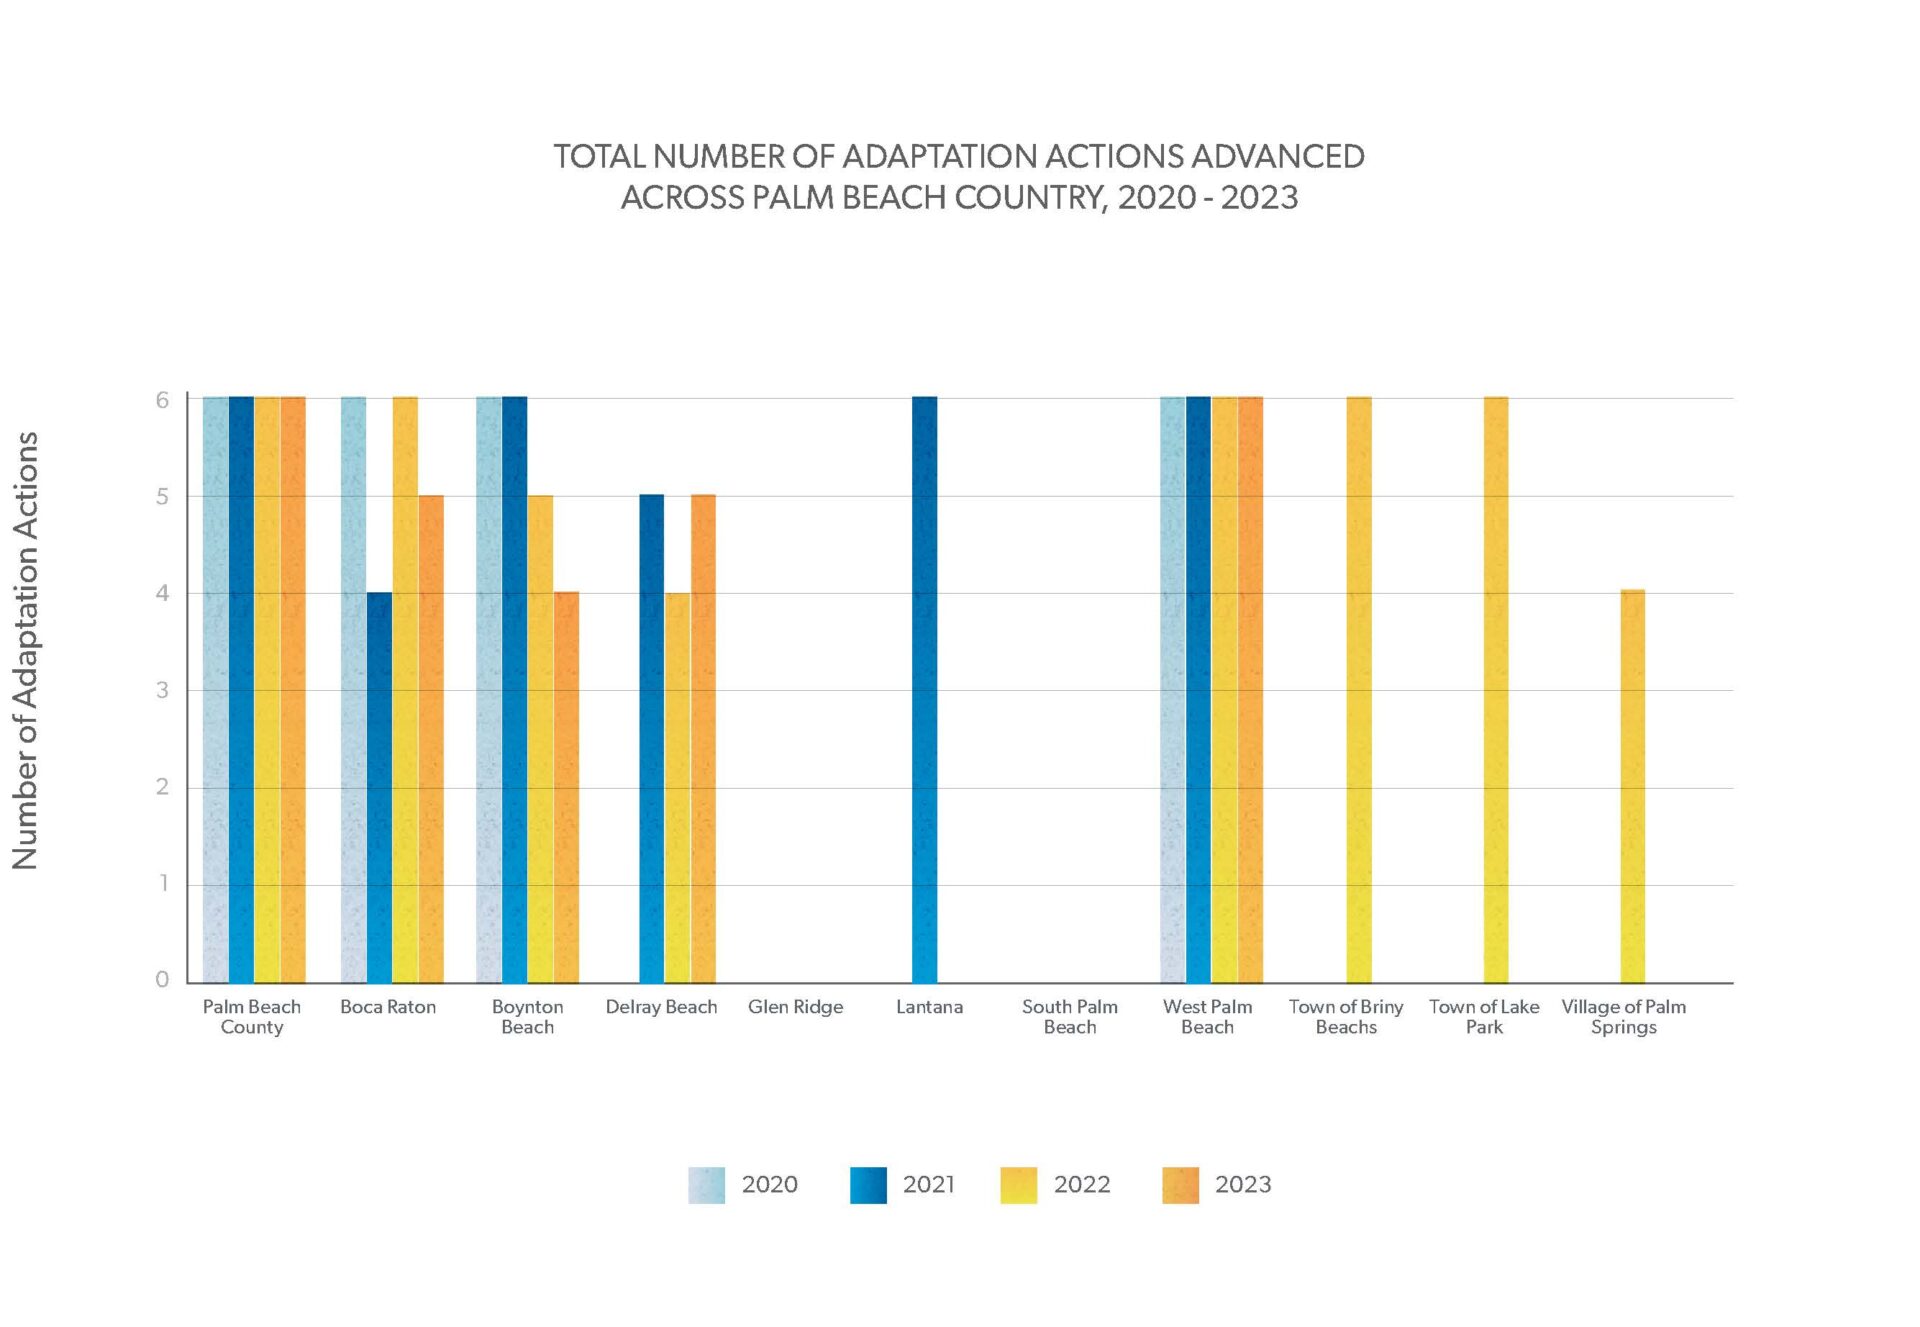
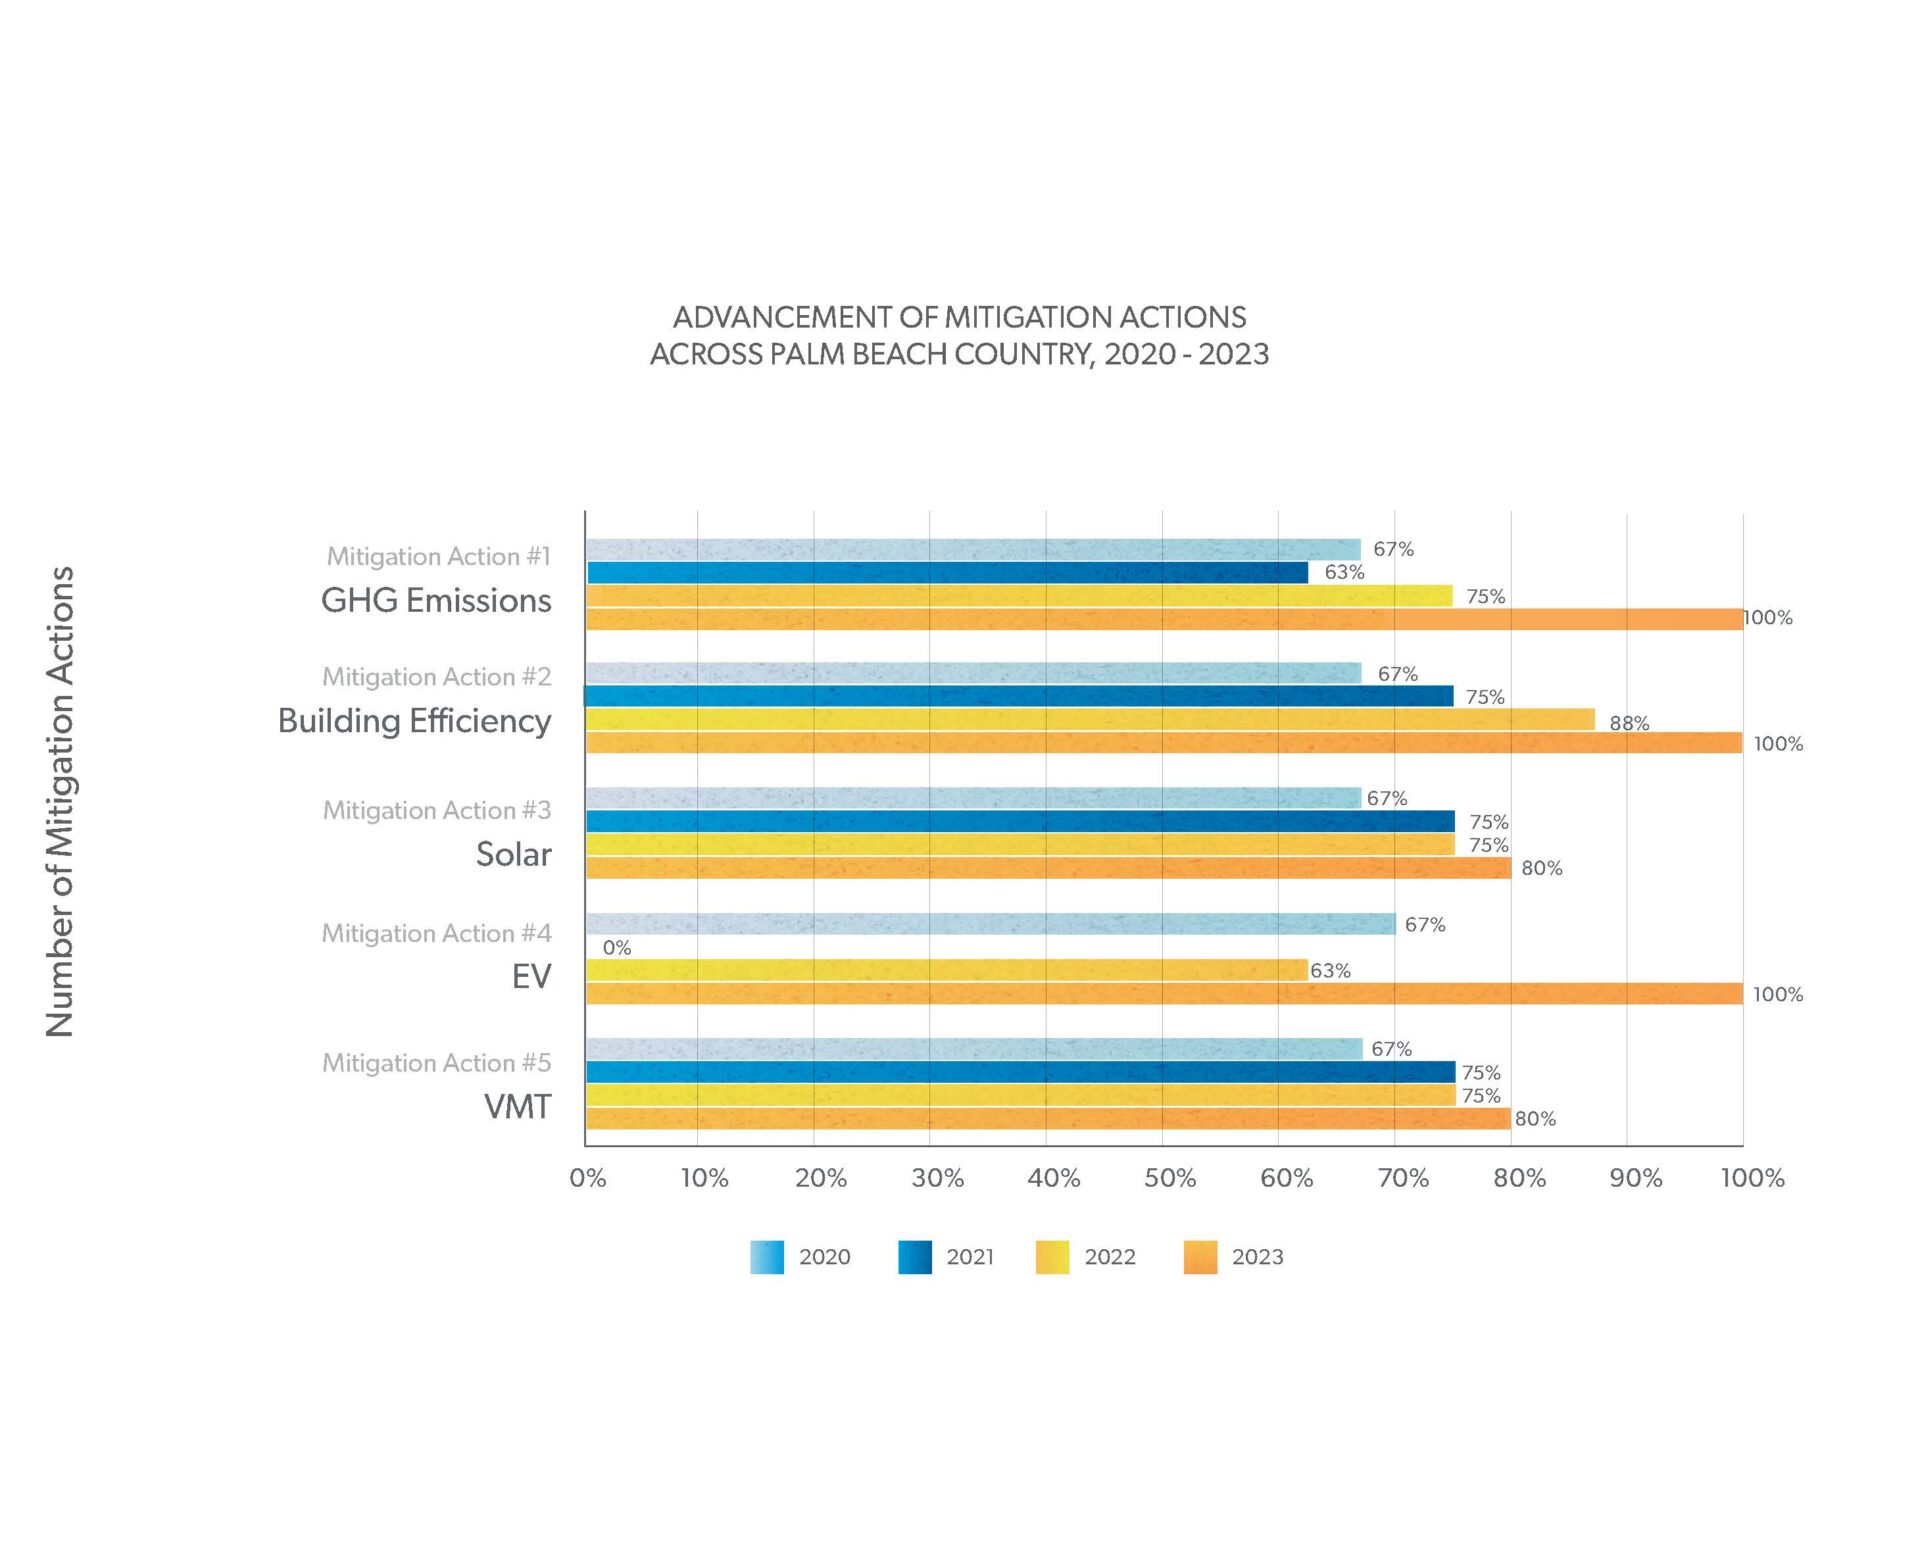
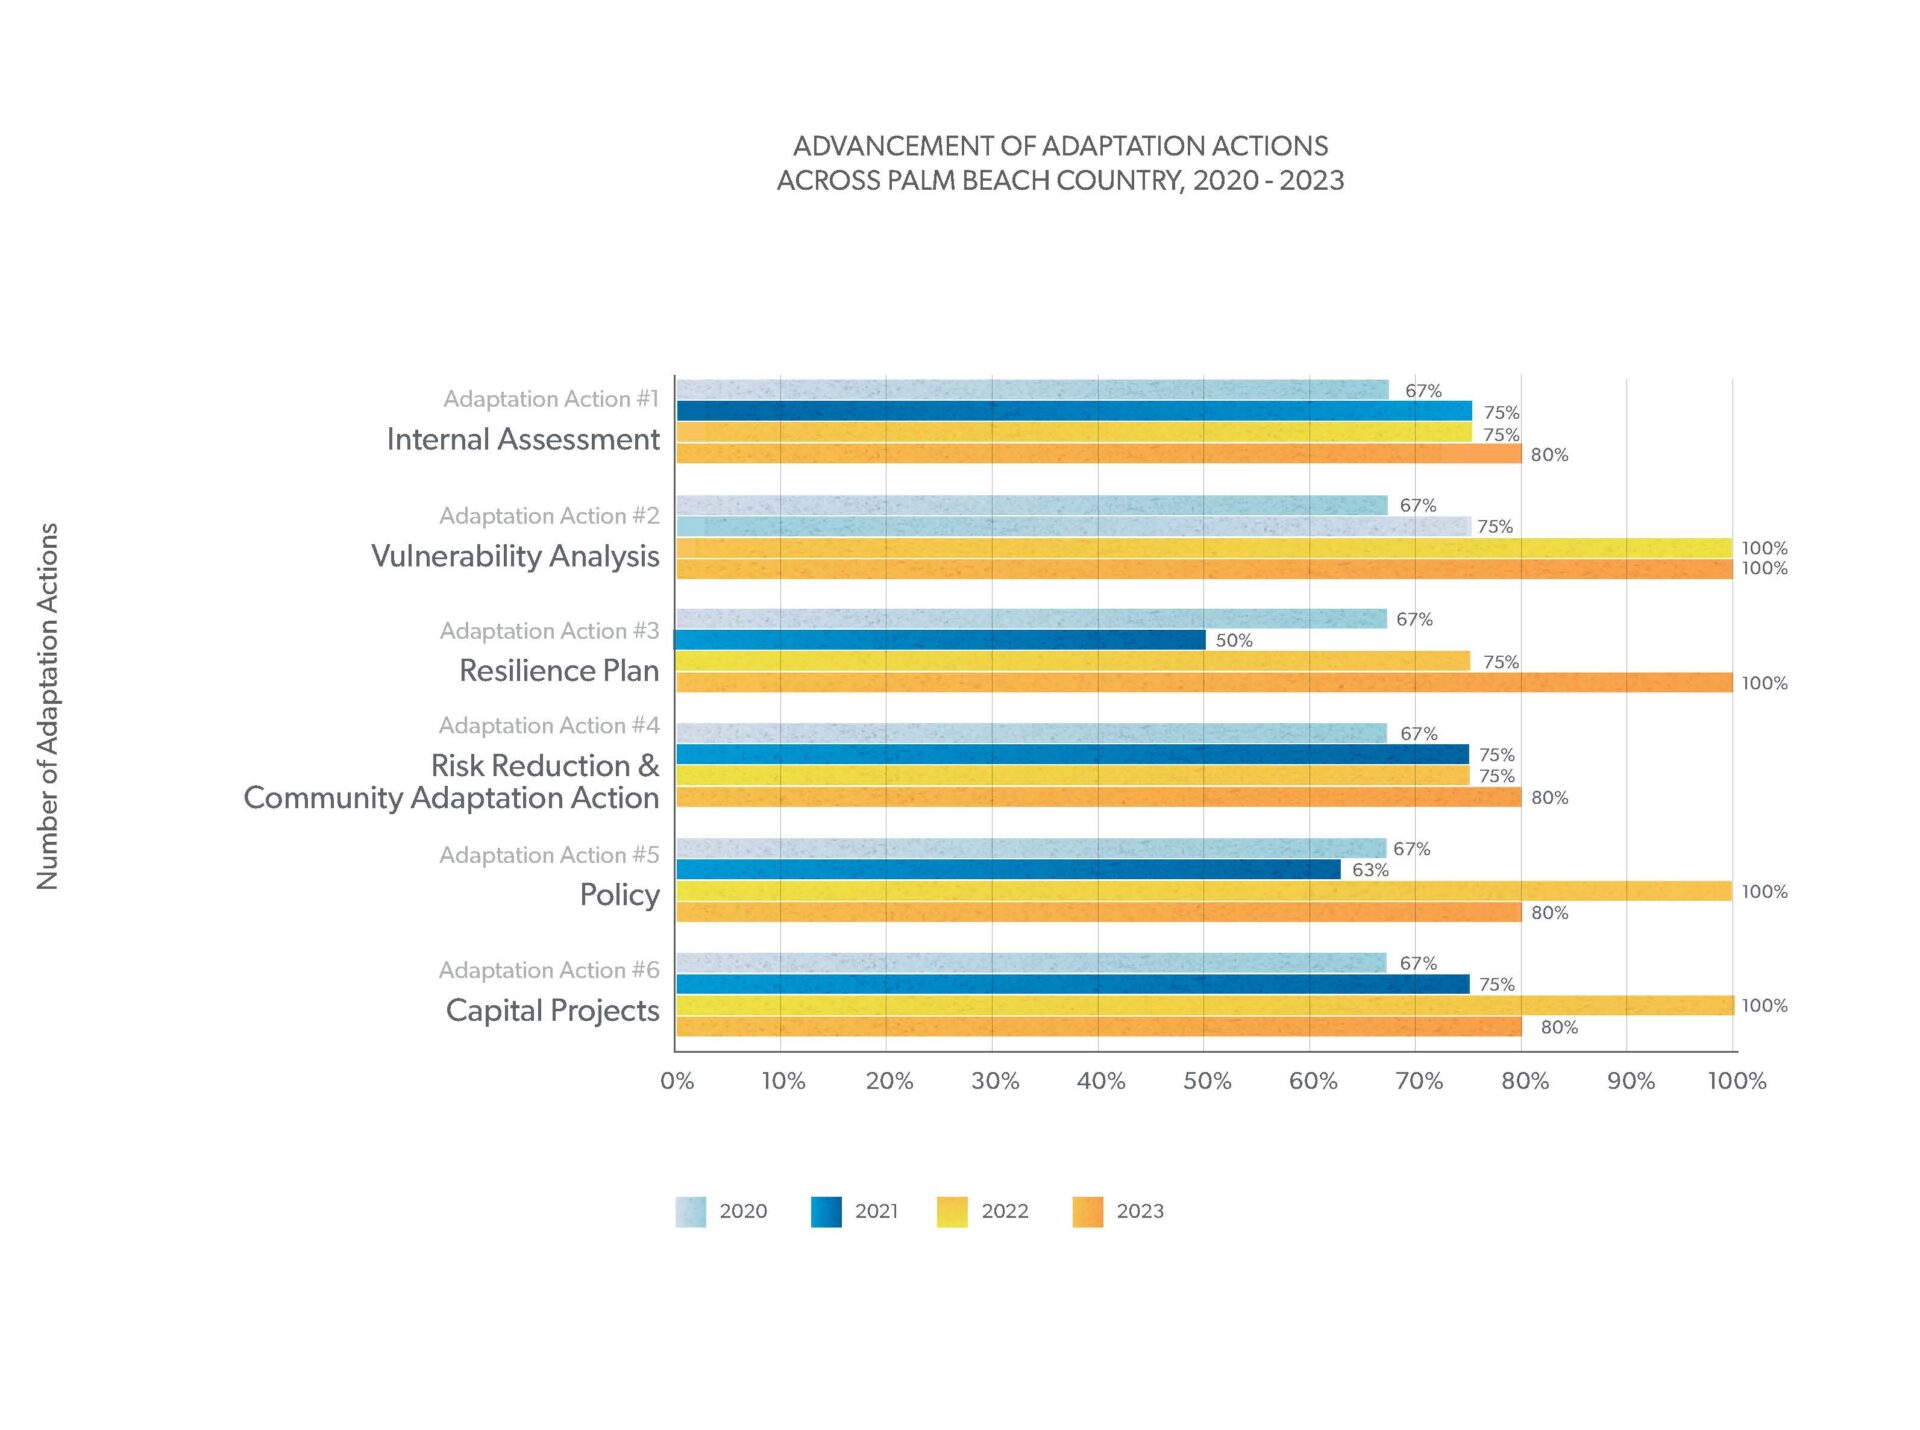
Palm Beach respondents are reporting the most progress on mitigation actions related to GHG emissions, improving building efficiency, and EVs, with 100% of respondents advancing these priorities. Related to adaptation priorities, progress is being made on completing a vulnerability analysis, and developing resilience plans, with 100% of respondents indicating they are advancing these priorities.
Local/Tribal Government Responses & Equity
The table below provides a snapshot of the progress that responding local and tribal governments are making to incorporate equity into the priority mitigation and adaptation actions. To view the full survey responses and all supporting documentation provided by the responding local/tribal governments, simply click on the jurisdiction’s name in the table. Survey responses will be downloaded as a PDF document.
Integration of equity into priority climate actions
Based on feedback regarding survey design following the first year of the survey’s administration, the Compact altered questions about equity to better reflect that integrating equity into climate efforts is an ongoing continuum of progress, rather than a binary activity that has been completed or not (e.g. yes versus no question). The table below reflects a self-assessment by the responding local/tribal governments on their jurisdiction’s progress toward these aims, with a sliding scale of “1” indicating that no progress has been made, and “5” indicating that significant progress has been made to integrate equity into the mitigation or adaptation priority action. As is true of the entirety of this selfassessment survey, the Compact does not validate or verify the responses provided, and acknowledges the imperfect, though still useful nature of qualitative self-reporting to provide a snapshot of regional climate action progress.
| Mitigation Action #1: GHG Emissions | Mitigation Action #2: Building Efficiency | Mitigation Action #3: Solar | Mitigation Action #4: EV | Mitigation Action #5: VMT | Adaptation Action #1: Internal Assessment | Adaptation Action #2: Vulnerability Analysis | Adaptation Action #3: Resilience Plan | Adaptation Action #4: Risk Reduction & Community Adaptation Action | Adaptation Action #5: Policy | Adaptation Action #6: Capital Projects | |
|---|---|---|---|---|---|---|---|---|---|---|---|
| Boca Raton | 2 | 2 | 2 | 2 | 2 | 1 | 4 | 3 | 1 | 2 | |
| Boynton Beach | 2 | 2 | 2 | 1 | 4 | 3 | 2 | 2 | |||
| Briny Breezes | |||||||||||
| Broward County | 4 | 4 | 4 | 4 | 4 | 4 | 4 | 4 | 4 | 4 | 4 |
| Coconut Creek | 2 | 3 | 3 | 3 | 3 | 3 | 3 | 3 | 3 | 3 | 3 |
| Coral Springs | 4 | 4 | 4 | 3 | 3 | 3 | 3 | 3 | 3 | 3 | 3 |
| Davie | 4 | 3 | 3 | 3 | 3 | 3 | 4 | 2 | 2 | 2 | 2 |
| Delray Beach | 2 | 2 | 2 | 2 | 2 | 2 | 2 | 2 | 2 | 2 | |
| Fort Lauderdale | 2 | 3 | 3 | 3 | 3 | 2 | 3 | 3 | 3 | 2 | 2 |
| Hallandale Beach | 4 | 4 | 3 | 4 | 3 | 2 | 4 | 4 | 3 | 3 | 3 |
| Hollywood | 2 | 3 | 2 | 3 | 4 | 2 | 2 | 2 | 3 | 1 | 3 |
| Islamorada | 2 | 2 | 3 | 3 | 2 | 2 | 3 | ||||
| Key Colony Beach | 3 | 2 | 2 | 2 | |||||||
| Key Biscayne | 2 | 1 | 1 | 1 | 4 | 1 | 1 | 2 | 3 | 1 | 3 |
| Lake Park | |||||||||||
| Marathon | |||||||||||
| Miami | 4 | 3 | 2 | 3 | 4 | 2 | 3 | 5 | 4 | 3 | 4 |
| Miami Beach | 3 | 2 | 2 | 2 | 4 | 4 | 4 | 4 | 3 | 3 | 4 |
| Miami Lakes | |||||||||||
| Miami Springs | |||||||||||
| Miami-Dade County | 4 | 3 | 4 | 2 | 3 | 3 | 4 | 4 | 4 | 3 | 3 |
| Monroe County | 1 | 2 | 2 | 3 | 2 | 4 | 3 | 1 | 1 | 2 | |
| North Bay Village | 3 | 3 | 2 | 4 | 3 | 3 | 3 | 3 | 3 | 3 | |
| Oakland Park | 3 | 2 | 2 | 2 | 2 | 3 | 4 | 4 | 1 | 1 | 2 |
| Palm Beach County | 3 | 4 | 2 | 2 | 2 | 4 | 2 | 2 | 2 | 2 | 2 |
| Palmetto Bay | 3 | 2 | 2 | 2 | 4 | 4 | 3 | ||||
| Pinecrest | |||||||||||
| Plantation | 2 | 2 | 3 | 4 | 3 | 3 | 2 | 3 | 3 | 3 | |
| Pompano Beach | 1 | 2 | 2 | 3 | 4 | 3 | 3 | 2 | 3 | 3 | 3 |
| Sunrise | 4 | 3 | 2 | 1 | 4 | 2 | 3 | 1 | 2 | 3 | |
| Village of Palm Springs | |||||||||||
| Weston | 3 | 3 | 3 | 3 | 4 | 1 | 1 | 3 | |||
| West Palm Beach | 3 | 3 | 3 | 3 | 3 | 3 | 3 | 3 | 3 | 3 | 3 |
| Wilton Manors | 4 | 2 | 4 | 4 | 4 | 4 | 4 | 4 | 3 | 2 | 2 |