Southeast Florida Community-Wide Greenhouse Gas Inventory 2019 and 2021
Through the establishment of the Southeast Florida Regional Climate Change Compact, Broward, Miami Dade, Monroe, and Palm Beach counties committed to collaborate on strategies to reduce the region’s emissions, including the development of an emissions baseline for Southeast Florida. A regional greenhouse gas emissions (GHG) inventory is integral to developing informed climate change mitigation strategies and monitoring the region’s progress over time.
In 2024, the Compact worked in partnership with ICLEI USA to conduct a community-wide inventory of greenhouse gas emissions for the four-county Compact region. The regional greenhouse gas (GHG) inventory report provides a summary of emissions trends across Broward, Miami- Dade, Monroe and Palm Beach Counties for 2019 and 2021, inclusive of commercial, residential, and industrial stationary energy; transportation and mobile sources; solid waste; water and wastewater; and agriculture and land use. The regional inventory is an assessment of community-wide emissions of predominant major greenhouse gases: carbon dioxide (CO2), methane (CH4), and nitrous oxide (N2O); and also includes emissions of sulfur hexafluoride (SF6), hydrofluorocarbons, and perfluorocarbons.
Results of the Compact’s inventory can be found on the tabs below.
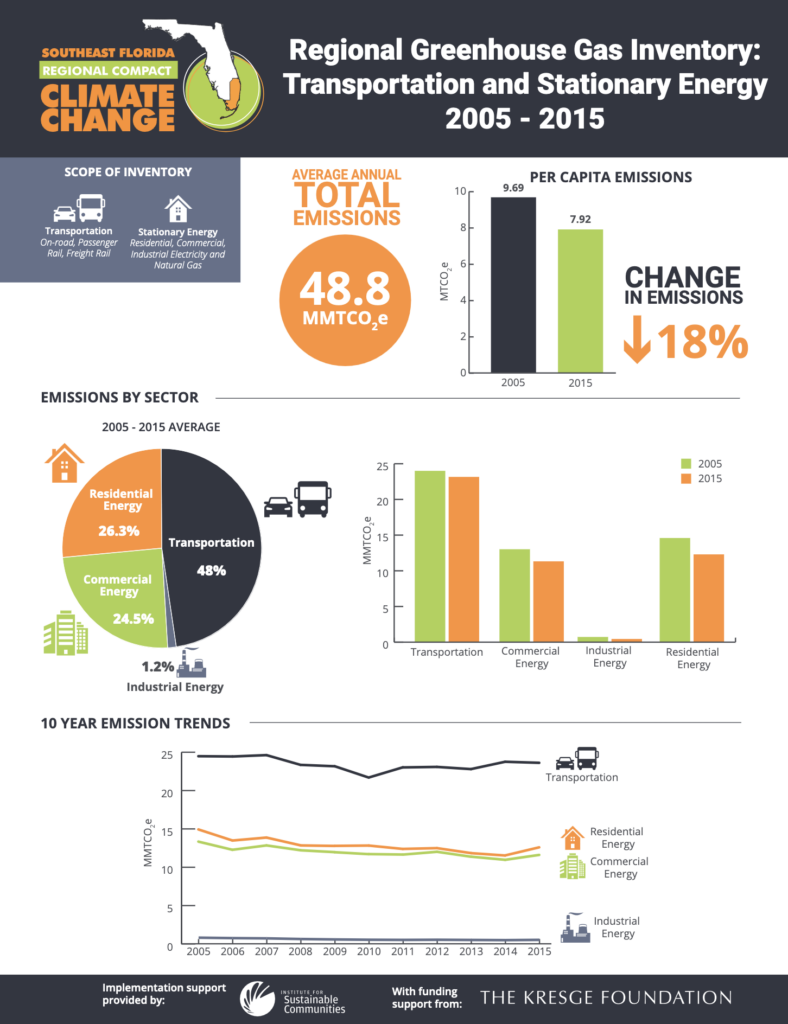
The Compact previously conducted an inventory of regional emissions from 2005 to 2015. However, the scope was limited to systems at the regional scale, including transportation (on-road transportation, passenger rail, and freight rail) and stationary energy from residential, commercial, and industrial buildings, making comparisons between the results of this inventory and the previous inventory difficult. The previous GHG inventory is archived at the bottom of this page for reference.
The Compact’s Regional Climate Action Plan 3.0 established a region-wide goal to reach net zero emissions by 2050, and the Compact is in the process of developing a regional GHG reduction plan through the Environmental Protection Agency’s Climate Pollution Reduction Grant, which will be completed in December 2025.
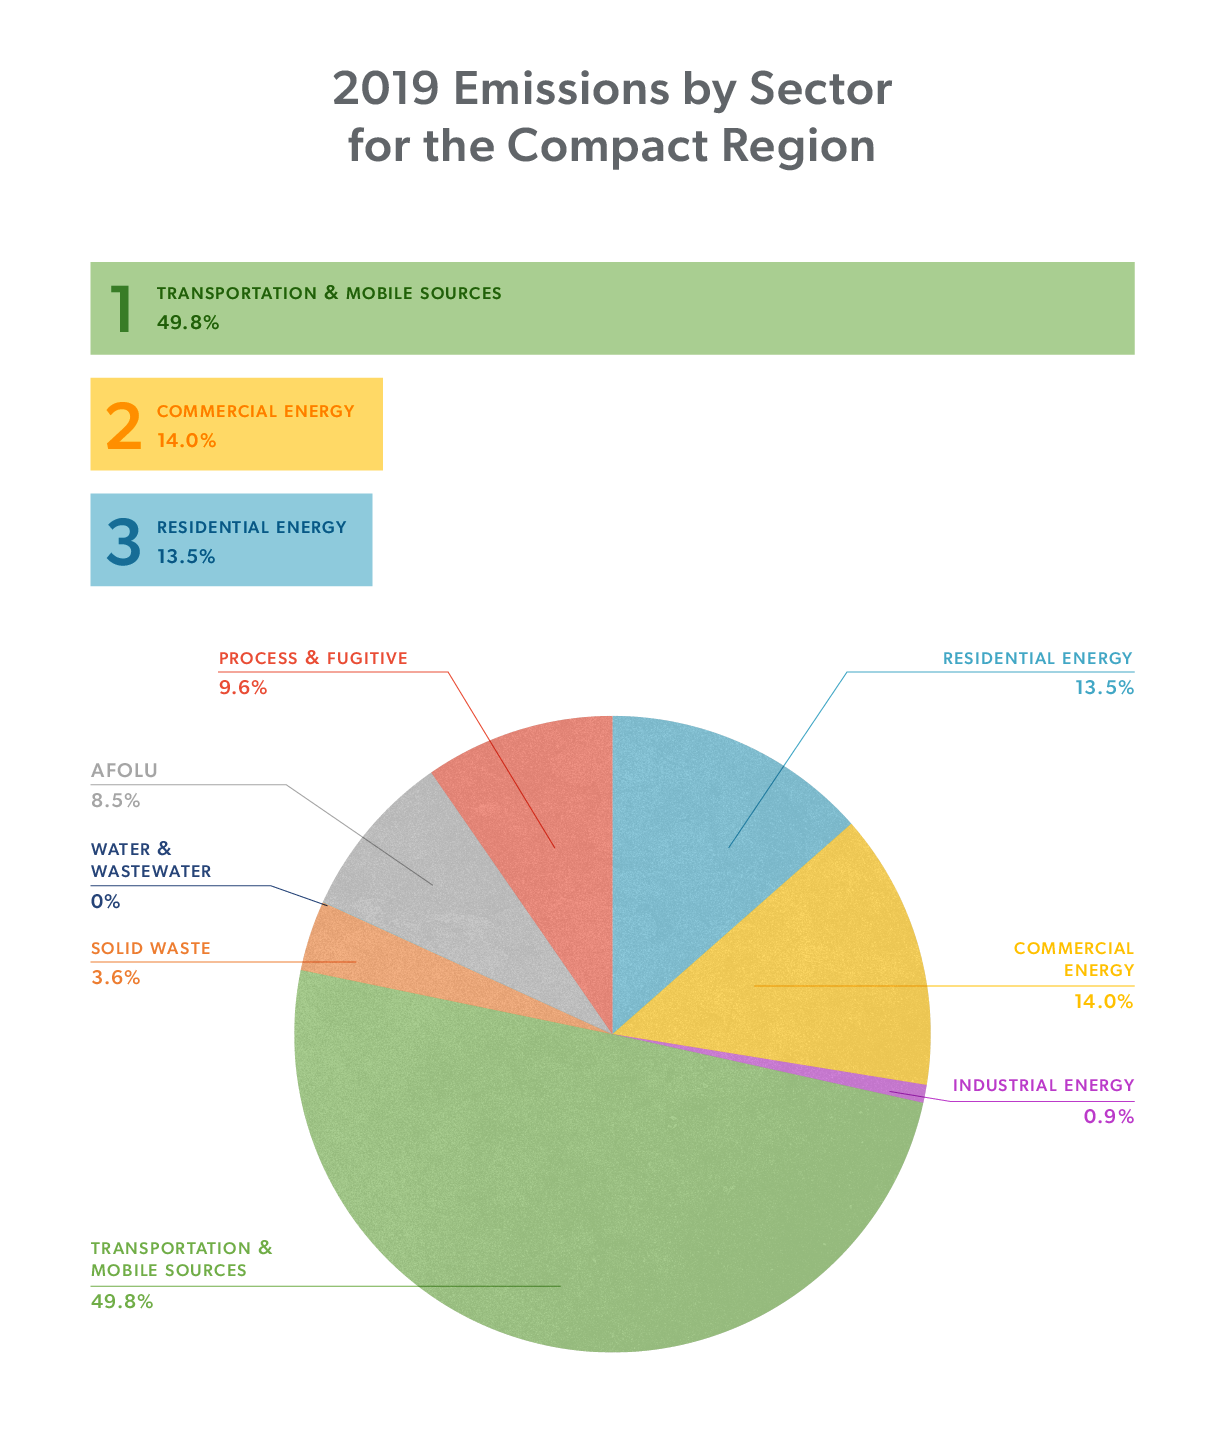
2019 Emissions by Sector
In 2019, transportation was the largest contributor to regional emissions (49.8%), followed by commercial energy (14%), and residential energy (13.5%).
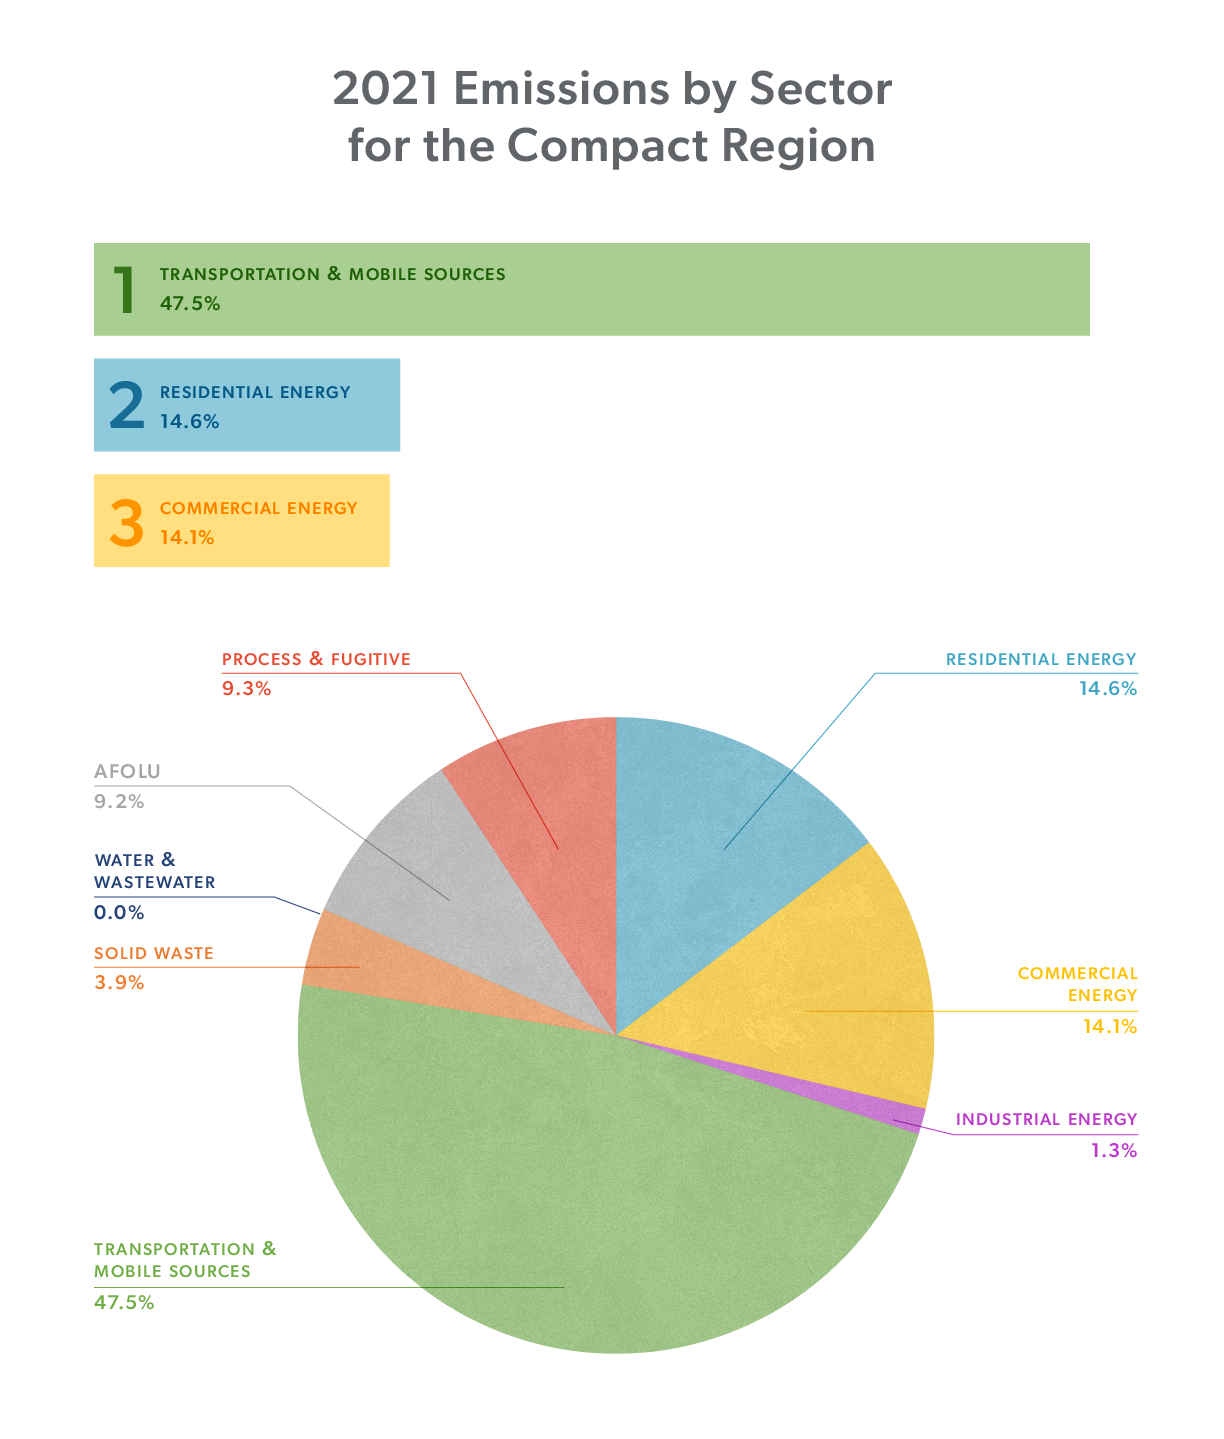
2021 Emissions by Sector
In 2021, transportation was the largest contributor (47.5%), followed by residential energy (14.6%), and commercial energy (14.1%).
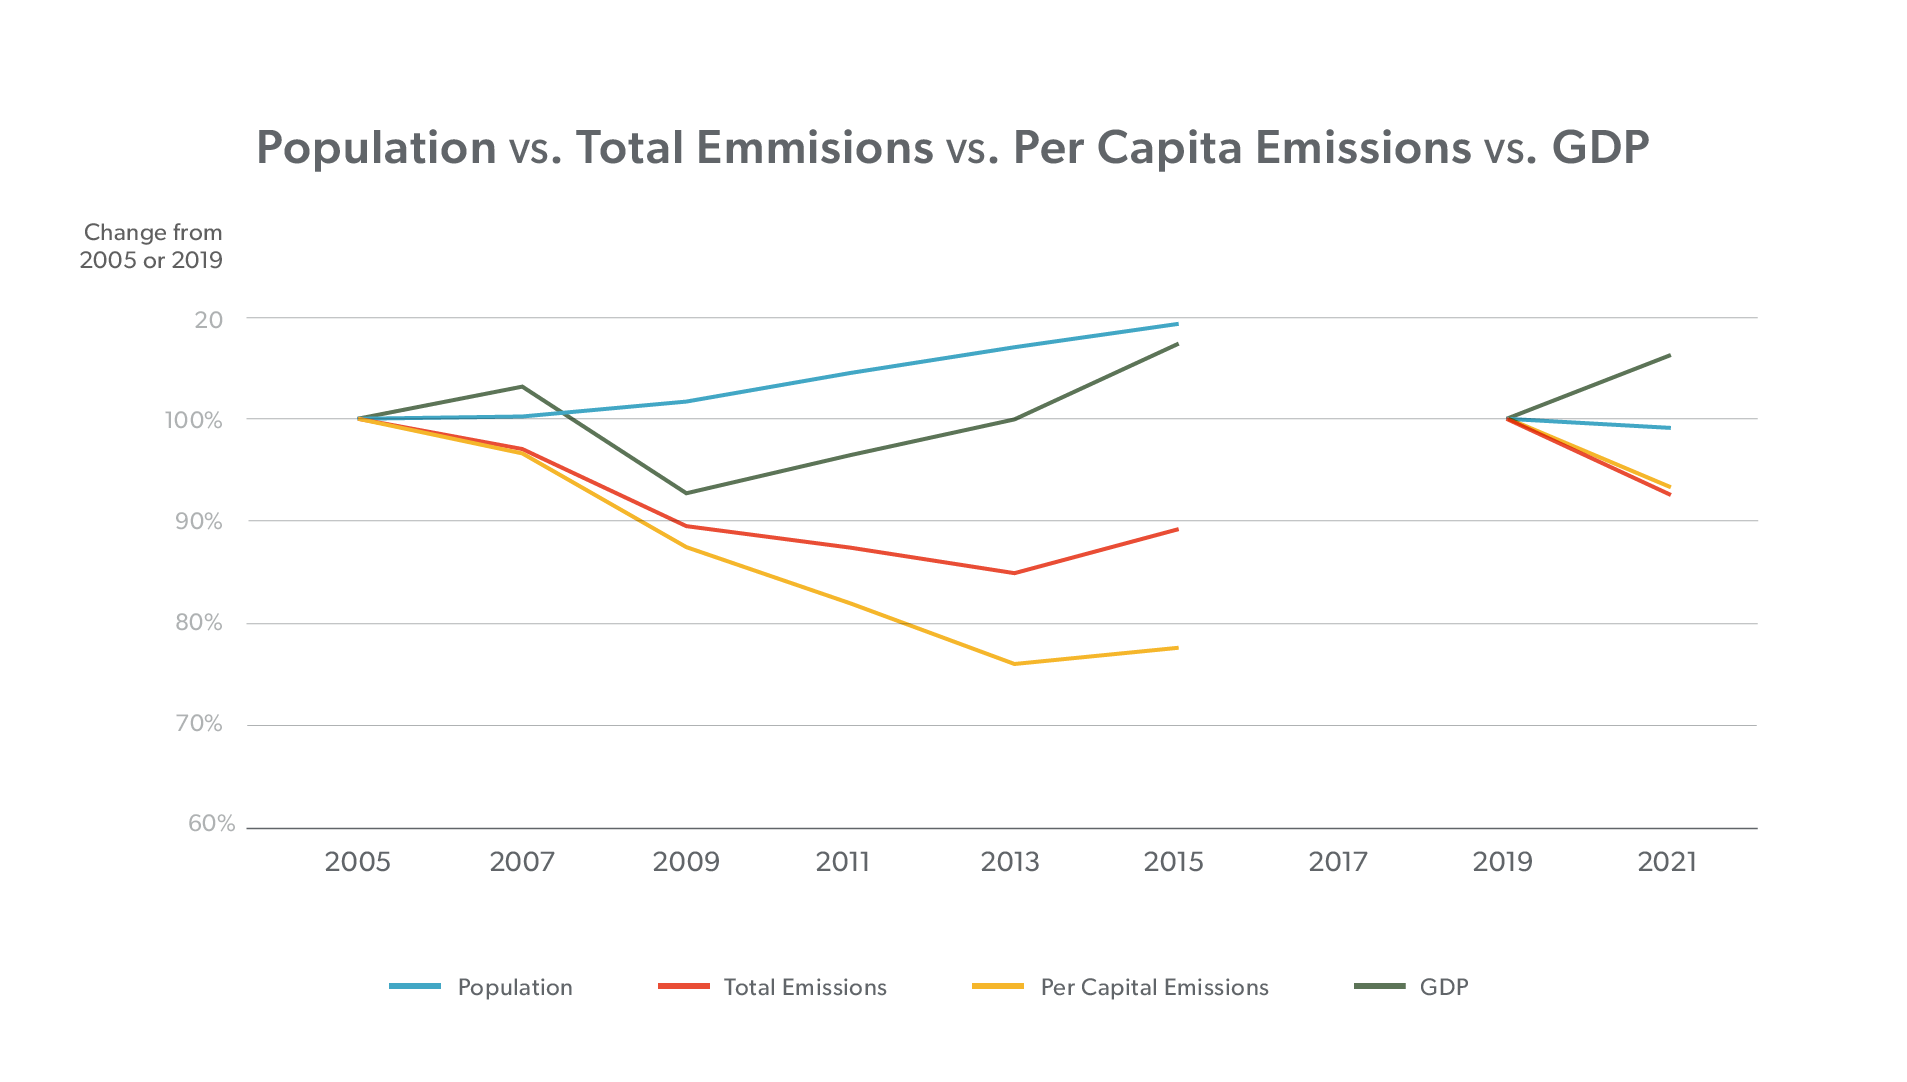
Population vs. Total Emissions vs. Per Capita Emissions vs GDP
Over the two-year period covered by this inventory, the region demonstrated a 7.4% decrease in overall emissions, while population declined less than 1.0% and gross domestic product increased 6.5%.
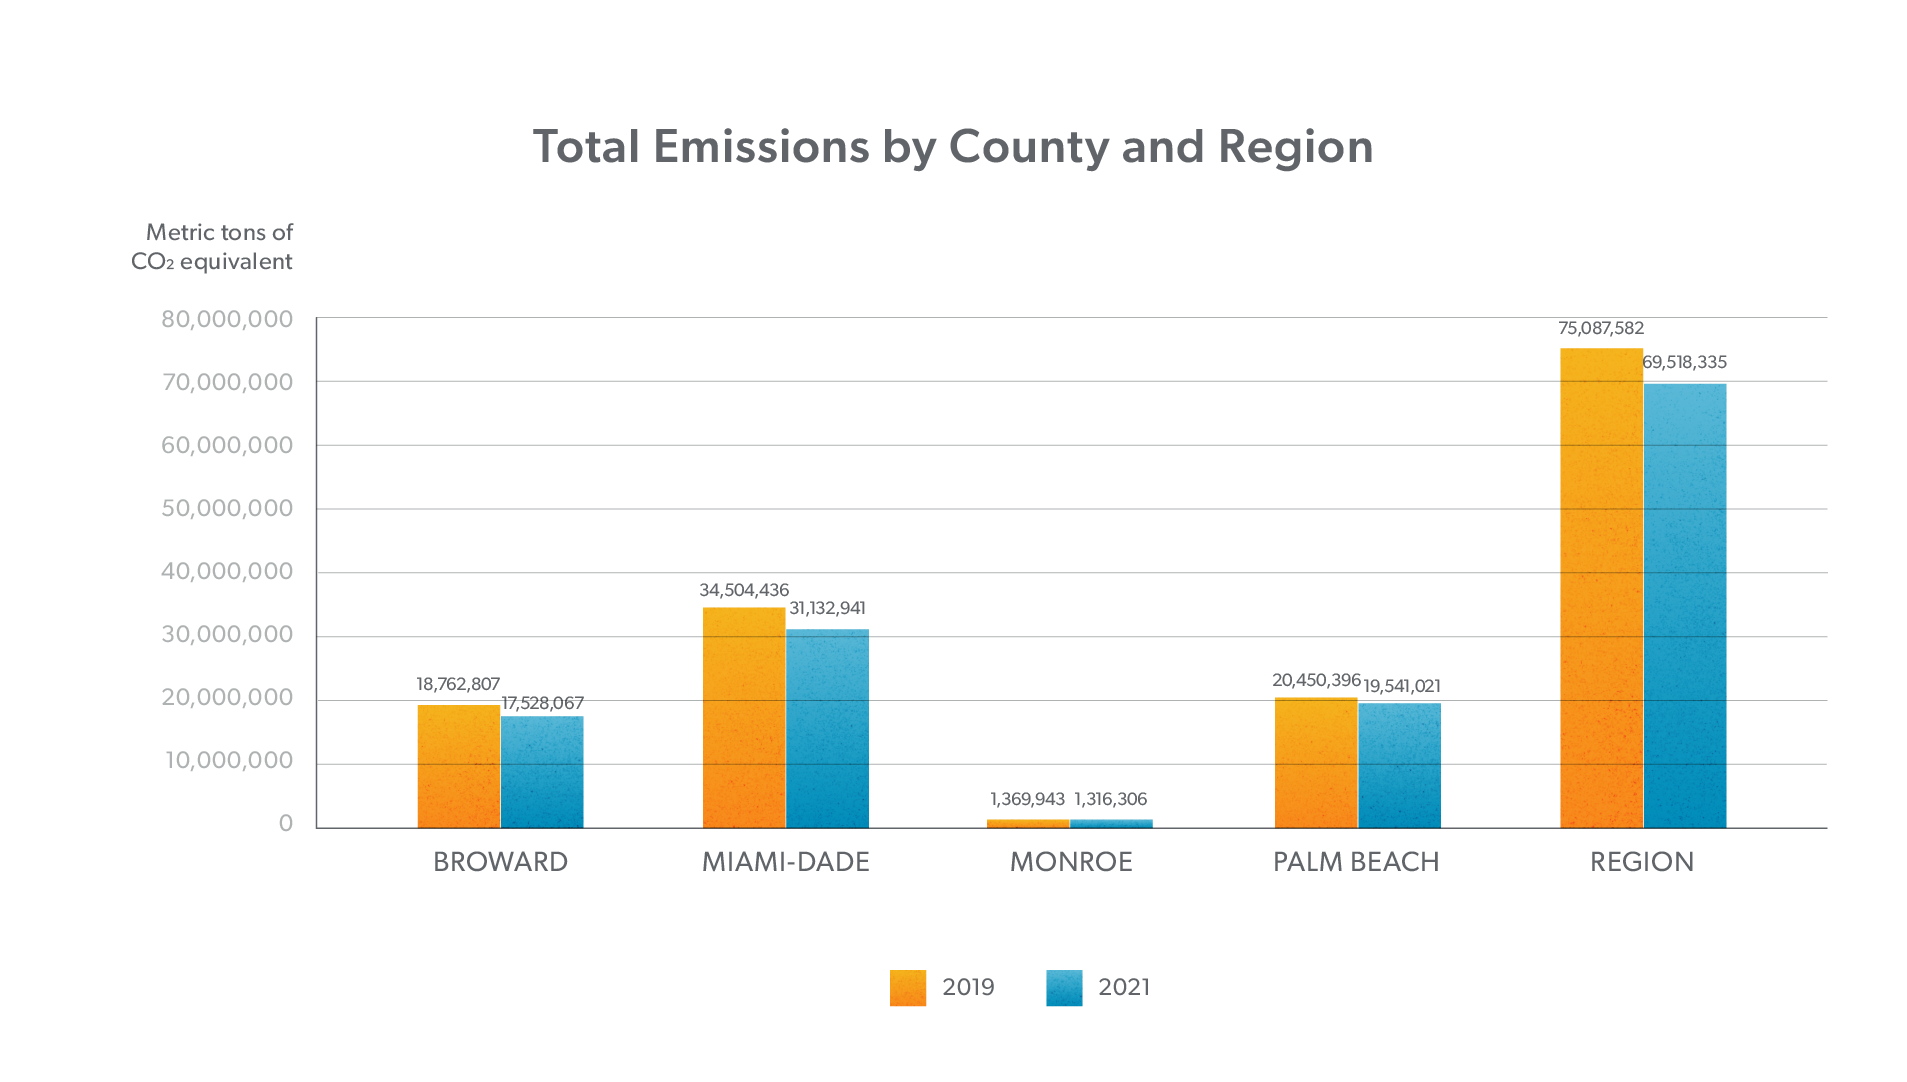
Total Emissions by County and Region
In 2019, the total greenhouse gas emissions emitted in the region was 75,087,582 MTCO2e. In 2021, the total decreased to 69,518,335 MTC02e, likely because of impacts of the COVID-19 pandemic. As a point of comparison, the Atlanta MSA, which has a very similar population size as the Compact region (6,144,050 as of July 1, 2021), generated roughly the same amount of emissions as the Compact, emitting 75,361,851 metric tons of carbon dioxide equivalents (MTCO2e) in 2019.
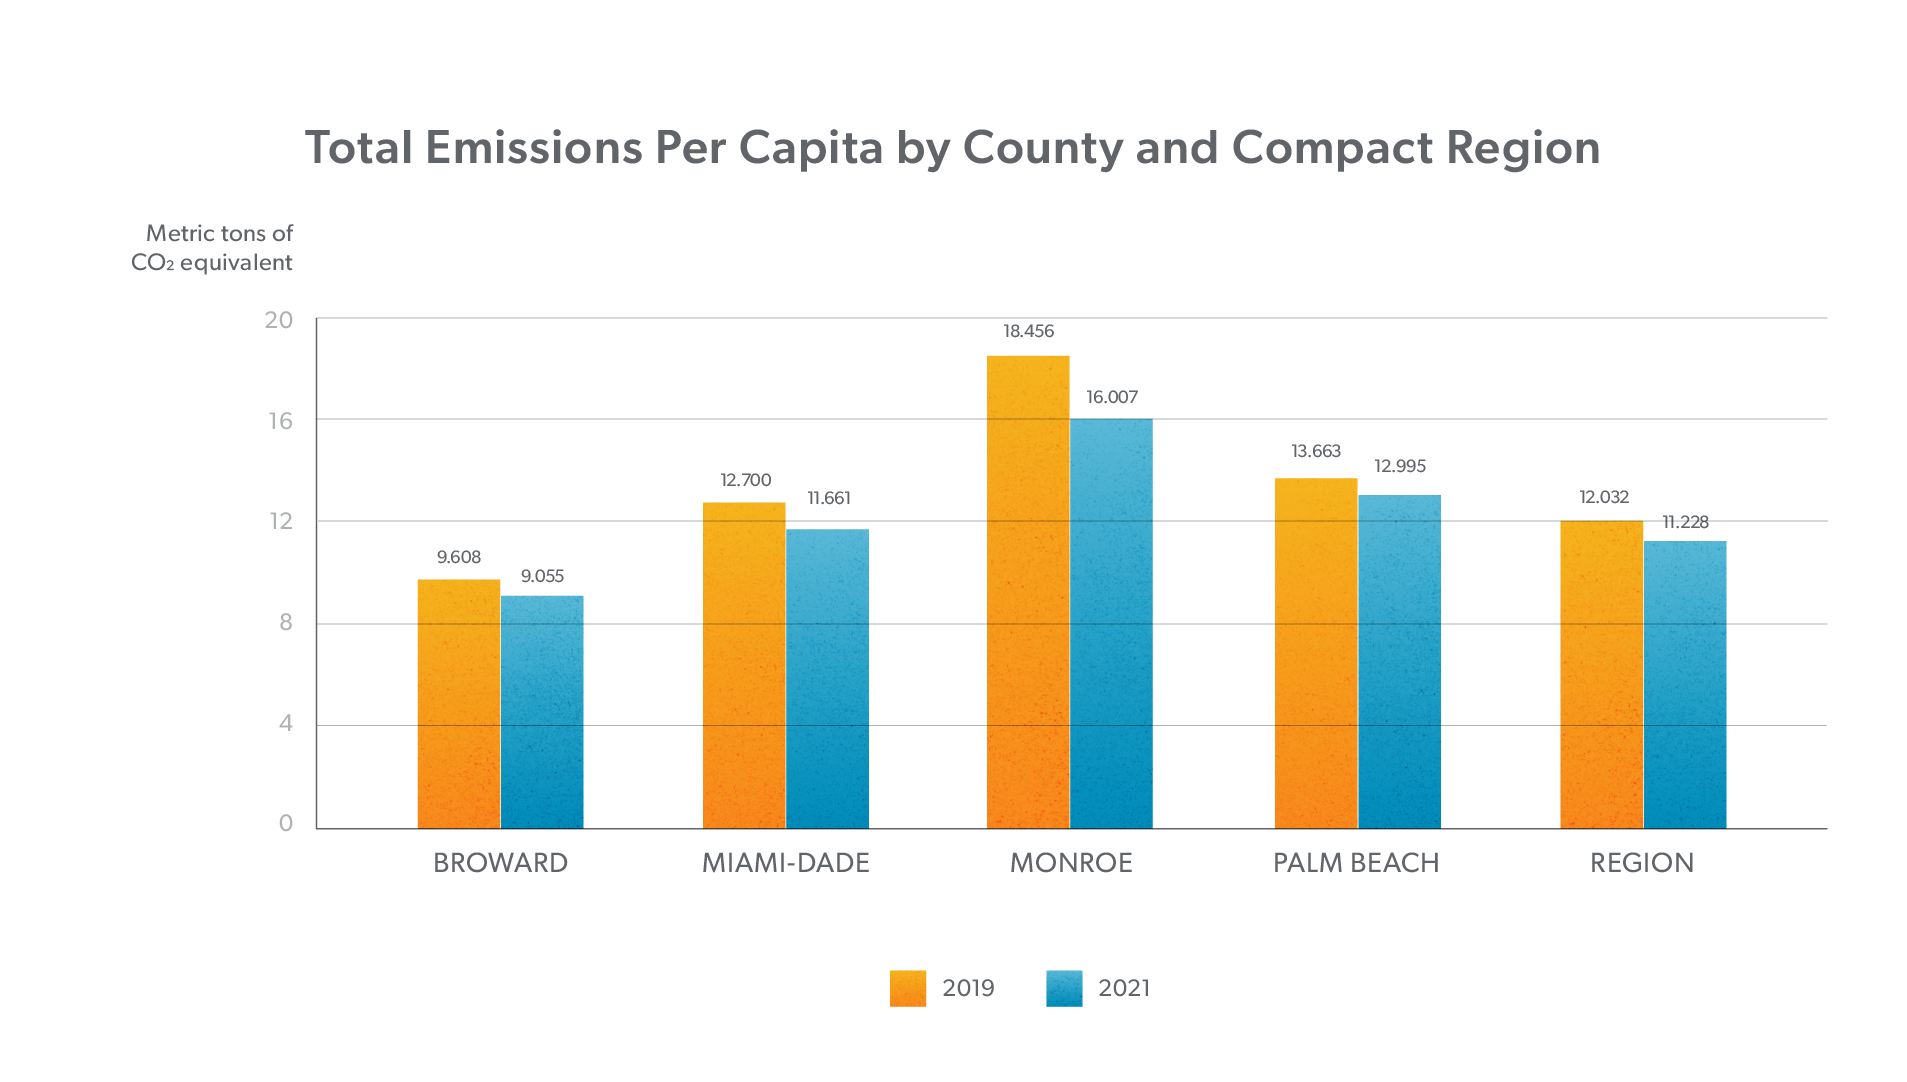
Total Emissions Per Capita by County and Compact Region
Emissions per capita in the Compact region were 12.032 MTC02e in 2019, and 11.228 MTC02e in 2021.