Climate Indicators
High Tide Flooding
Observed High Tide Flooding
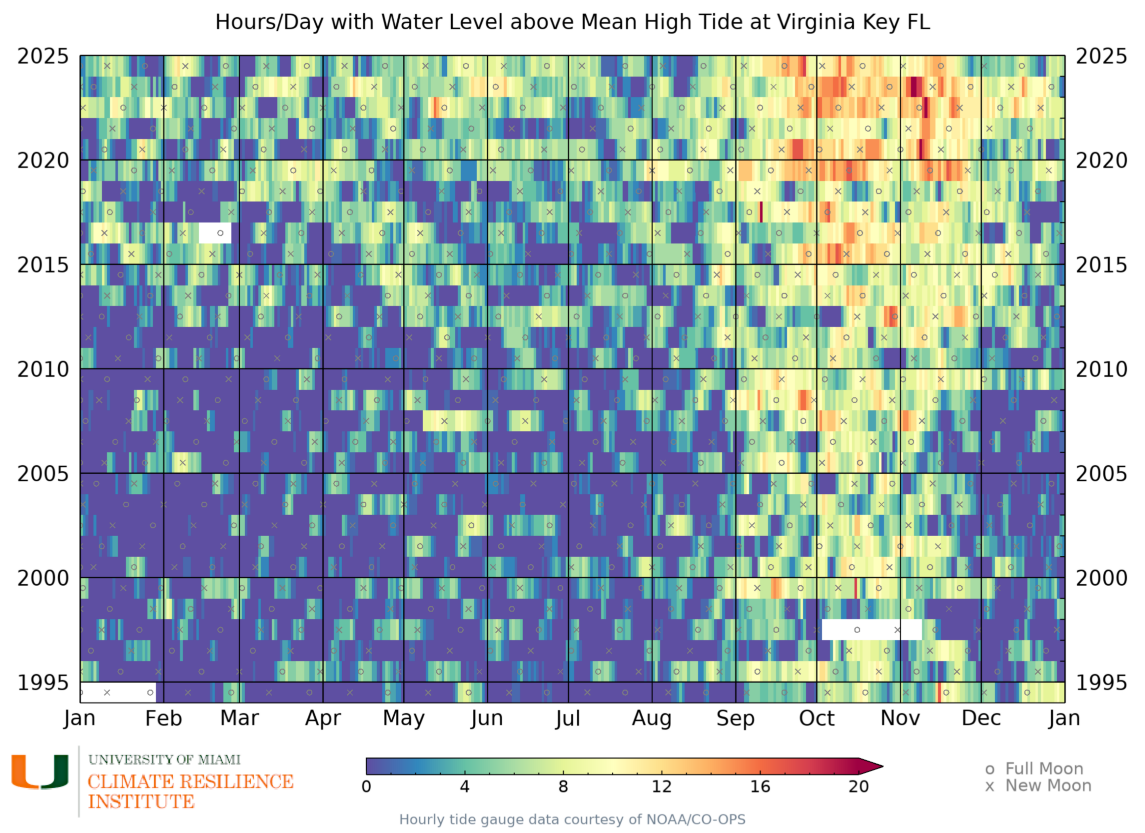
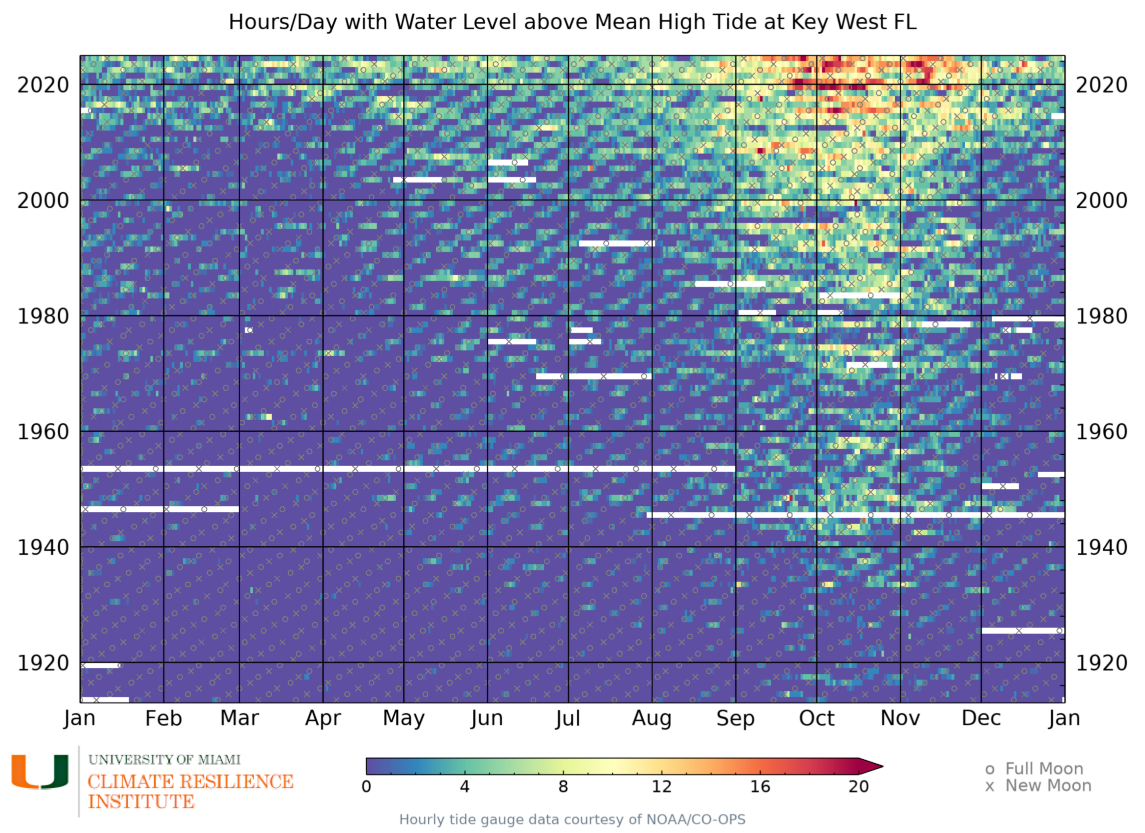
High tide flooding, sometimes referred to as sunny day or nuisance flooding, occurs when sea level rise combines with local factors to push water levels above the normal high tide mark. King Tides are the highest predicted high tides of the year, and the highest tides in the Southeast Florida region occur in the fall, in part because the water is warmer and the seasonal winds drive water levels higher at that time of year. As sea level rises, these extreme high tides are increasing in frequency and length.
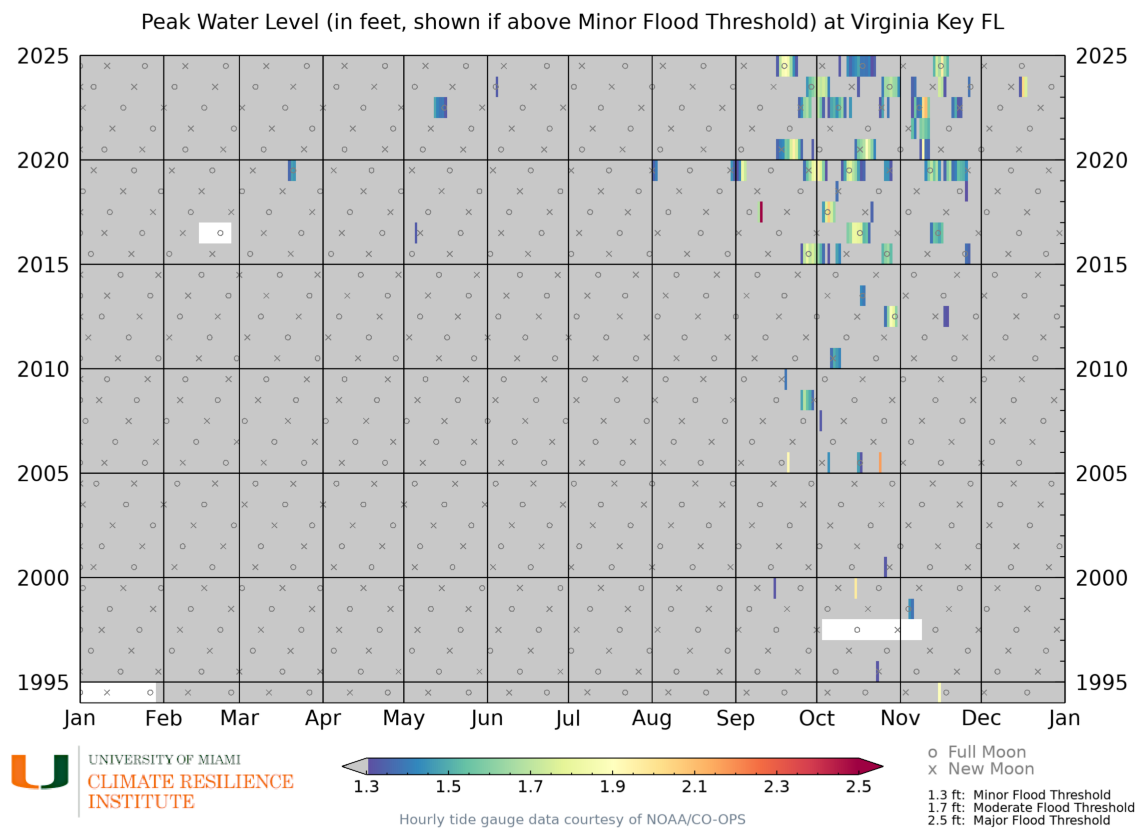
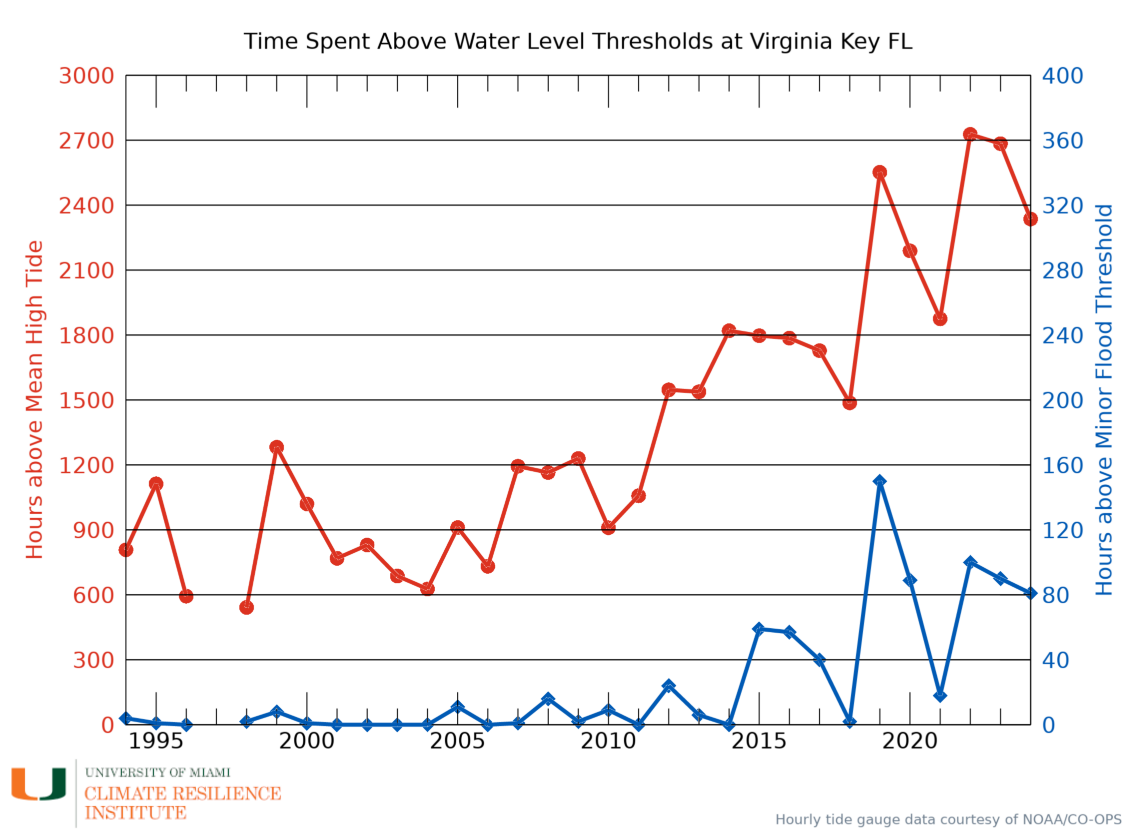
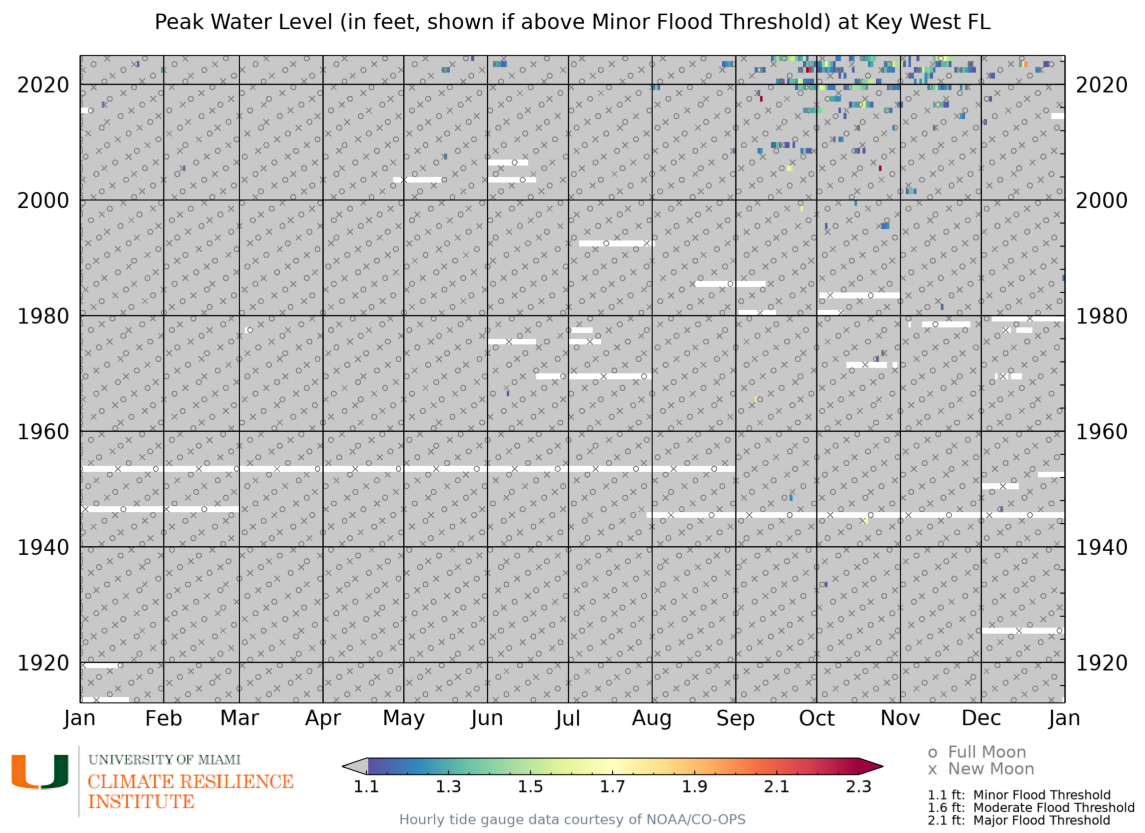
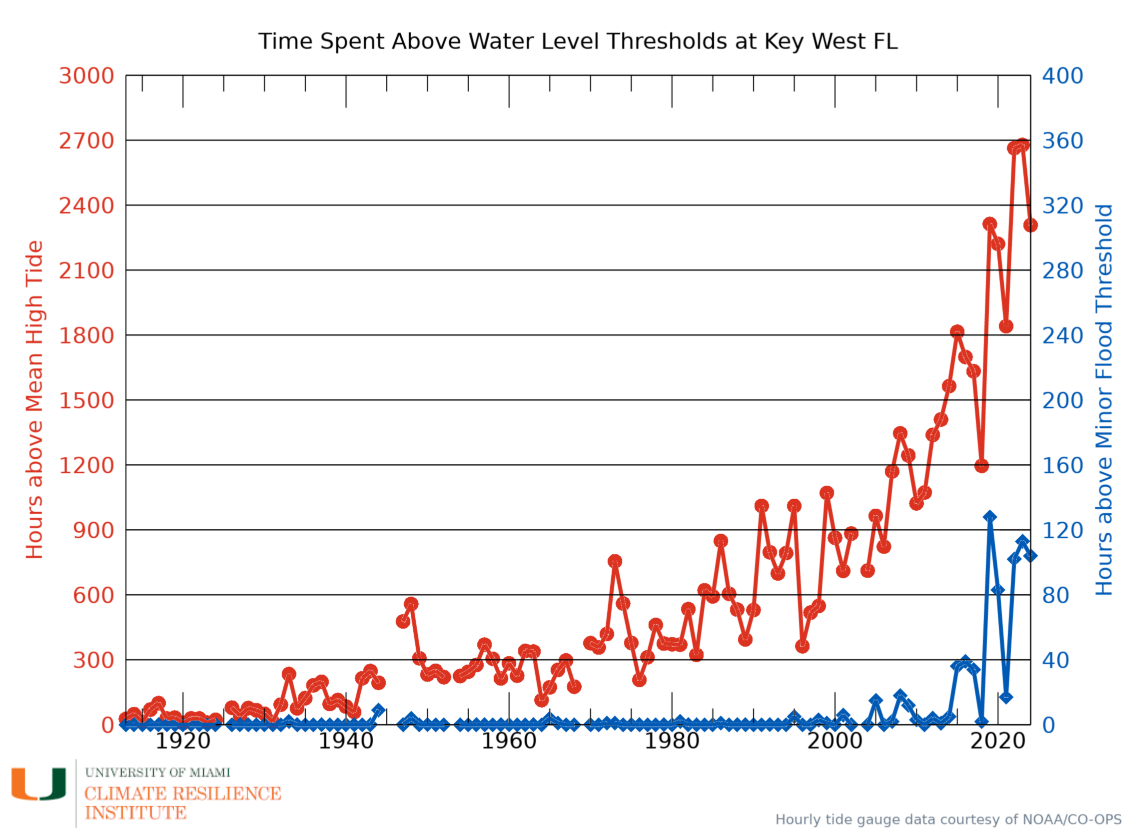
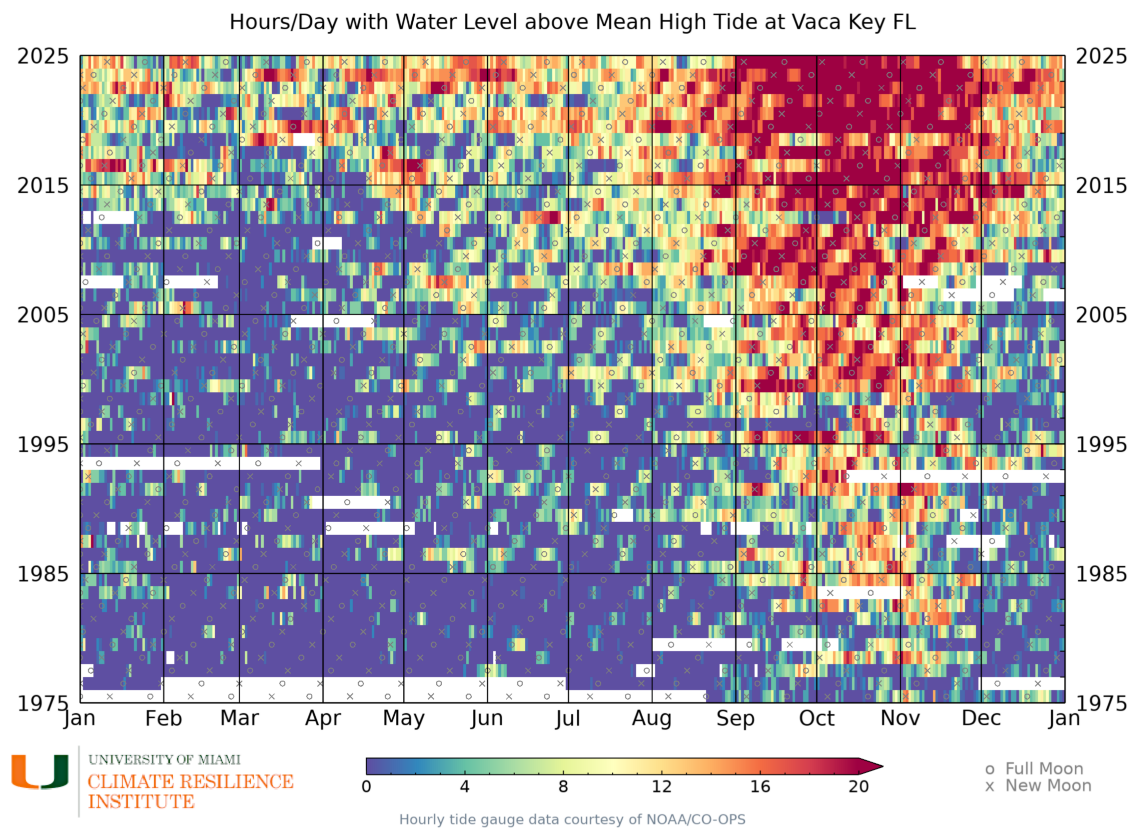
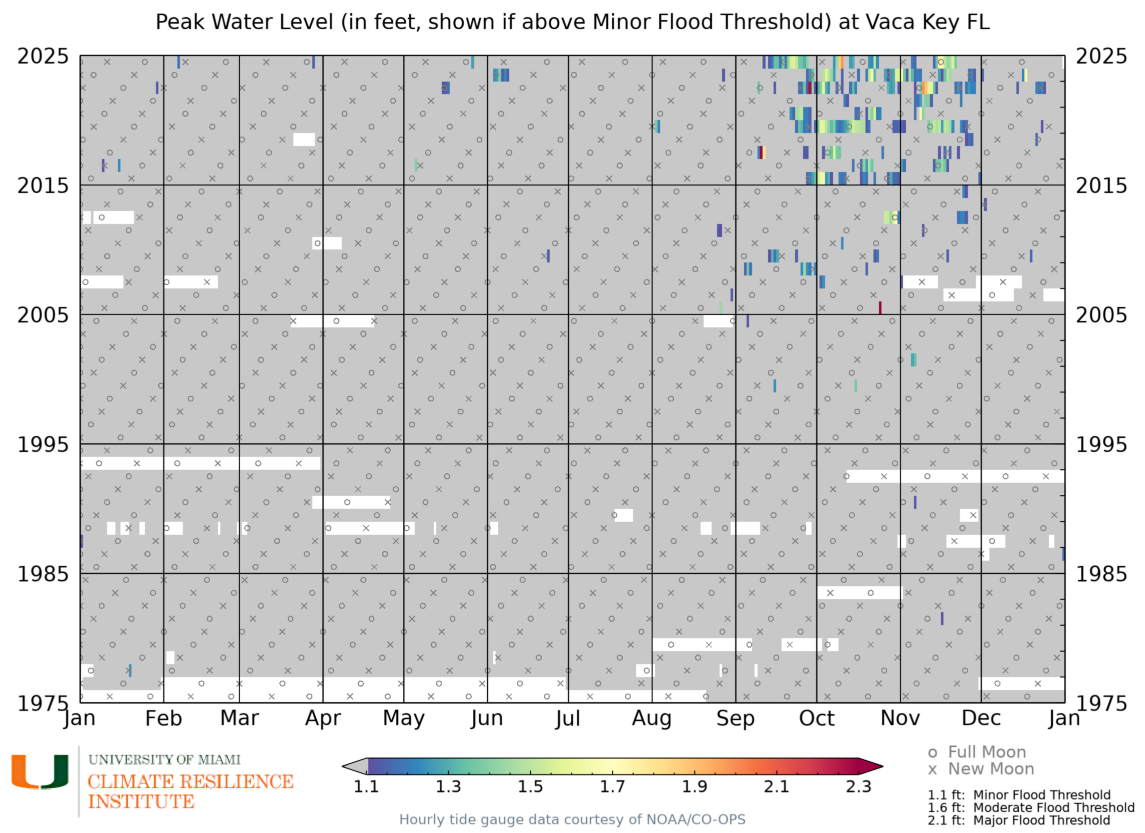
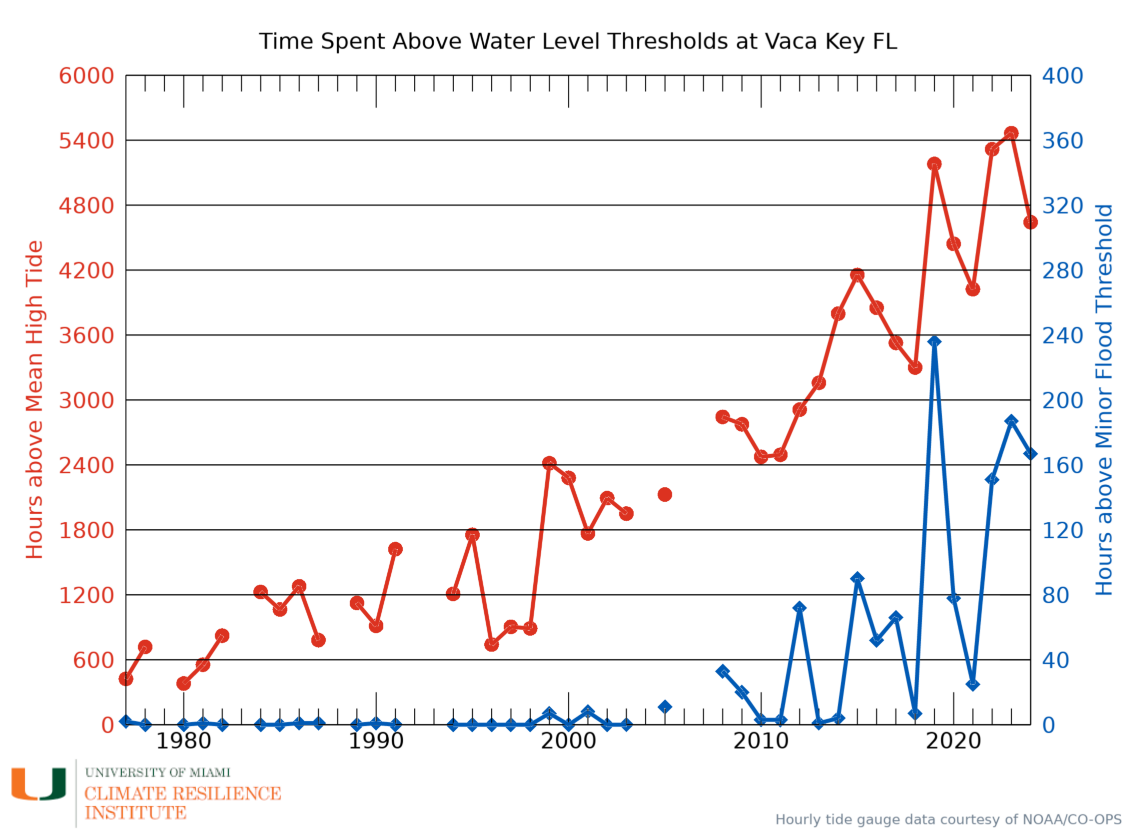
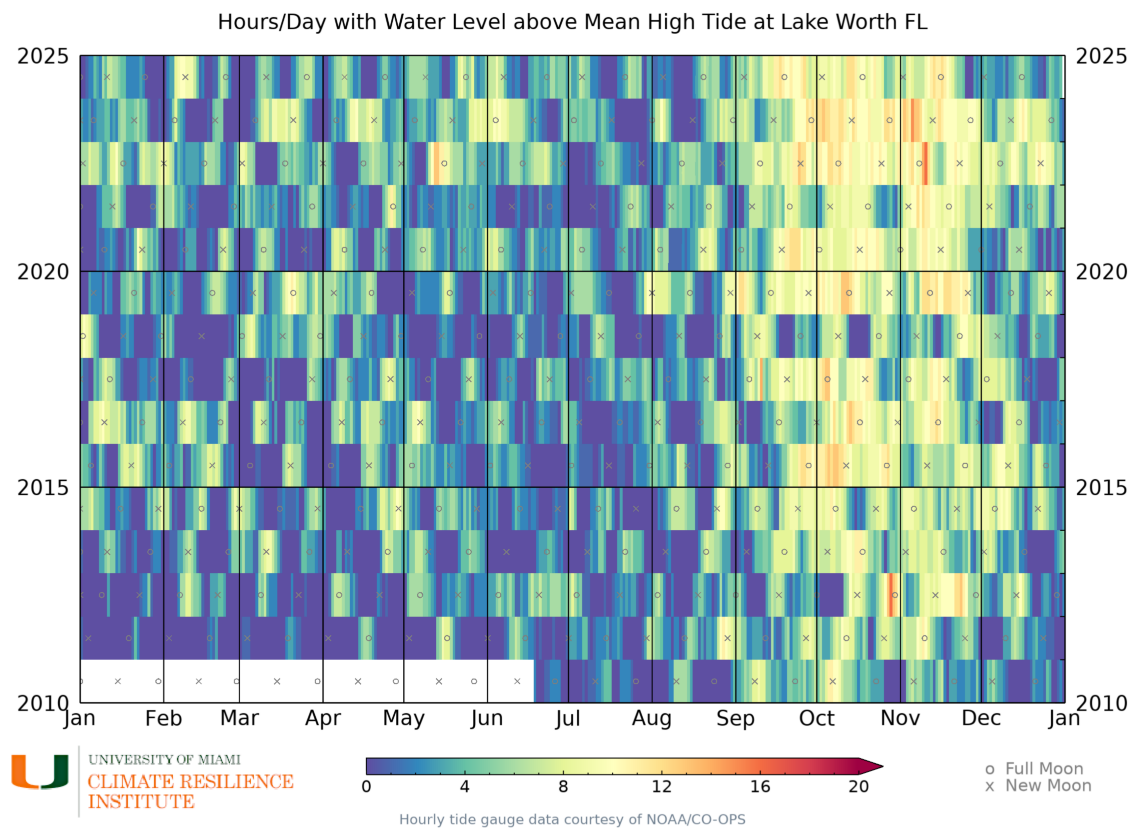
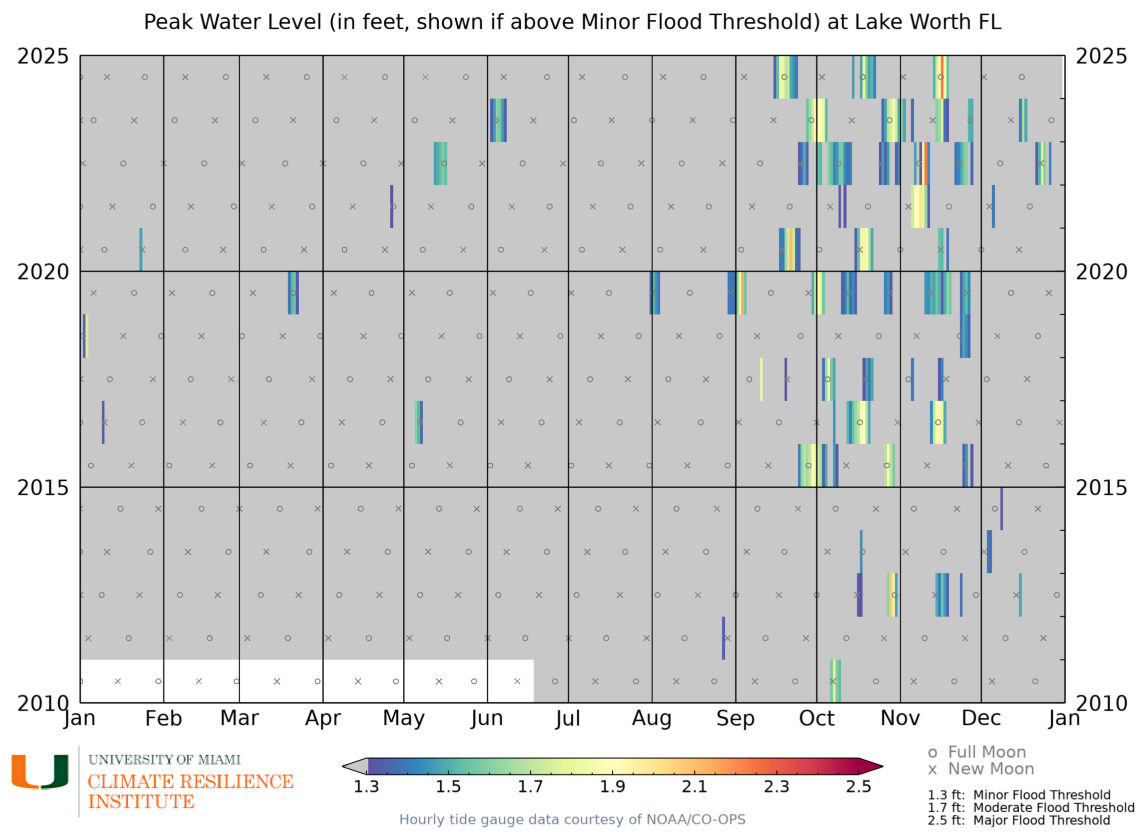
Over the last five to 10 years in the Compact region, increasing occurrences of flooding during King Tide events have been observed across all counties, as demonstrated by the number of hours/day spent with water levels above mean high tide, and the hours/day with peak water levels above the minor flood threshold. This trend is less pronounced at the Lake Worth tidal gauge because the period of record is short (dating back to 2010) in comparison to the other gauges throughout the region. It is expected that these flood events will increase in the future due to accelerating sea level rise.
NOAA’s National Weather Service (NWS) has established locally relevant minor, moderate, and major flood severity thresholds for dozens of tide gauges along the U.S. coastline. The graphics below use either the station’s mean high tide or the NWS’s minor flood threshold for each tidal gauge, given that even when the water level is slightly below the “minor flood” threshold, flood impacts can occur in the region. For reference, the table summarizes these values for each tidal gauge location included below.

Miami-Dade County
Monroe County
Palm Beach County
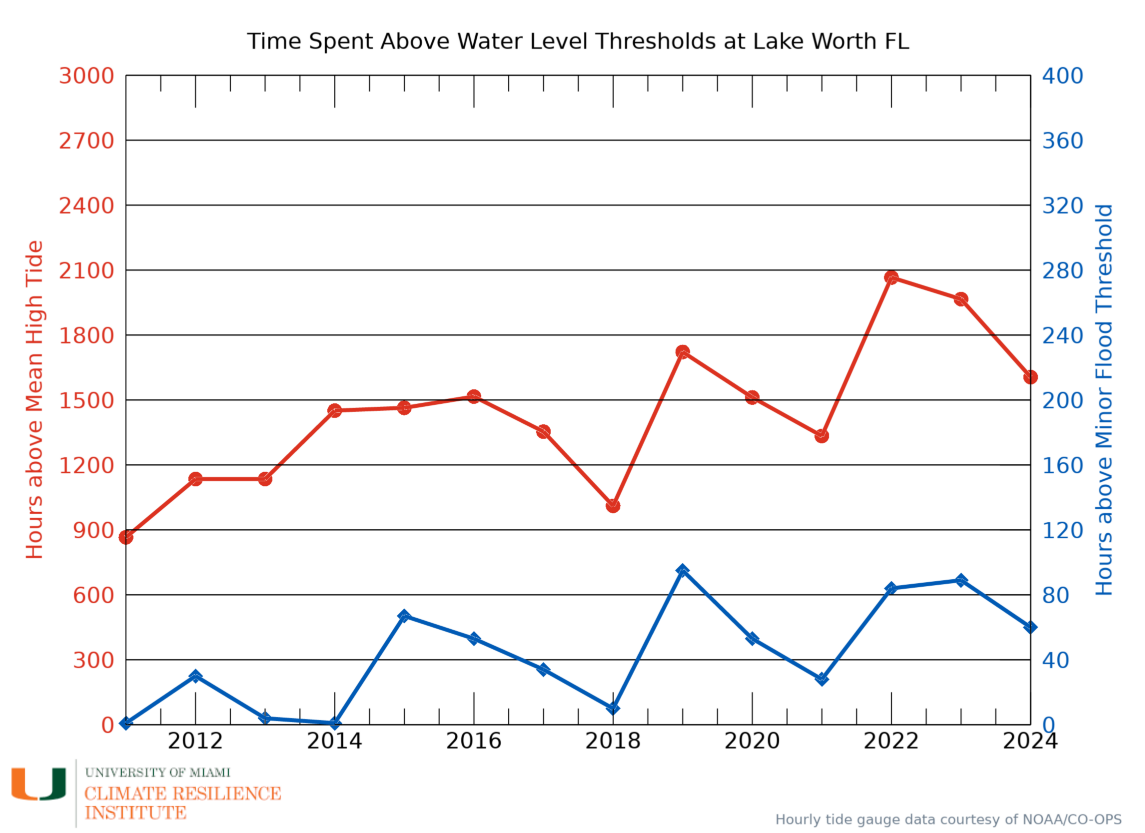
Source: NOAA’s Center for Operational Oceanographic Products and Services (CO-OPS), Tides and Currents. The above charts are provided courtesy of the University of Miami’s Climate Resilience Institute, 2025.
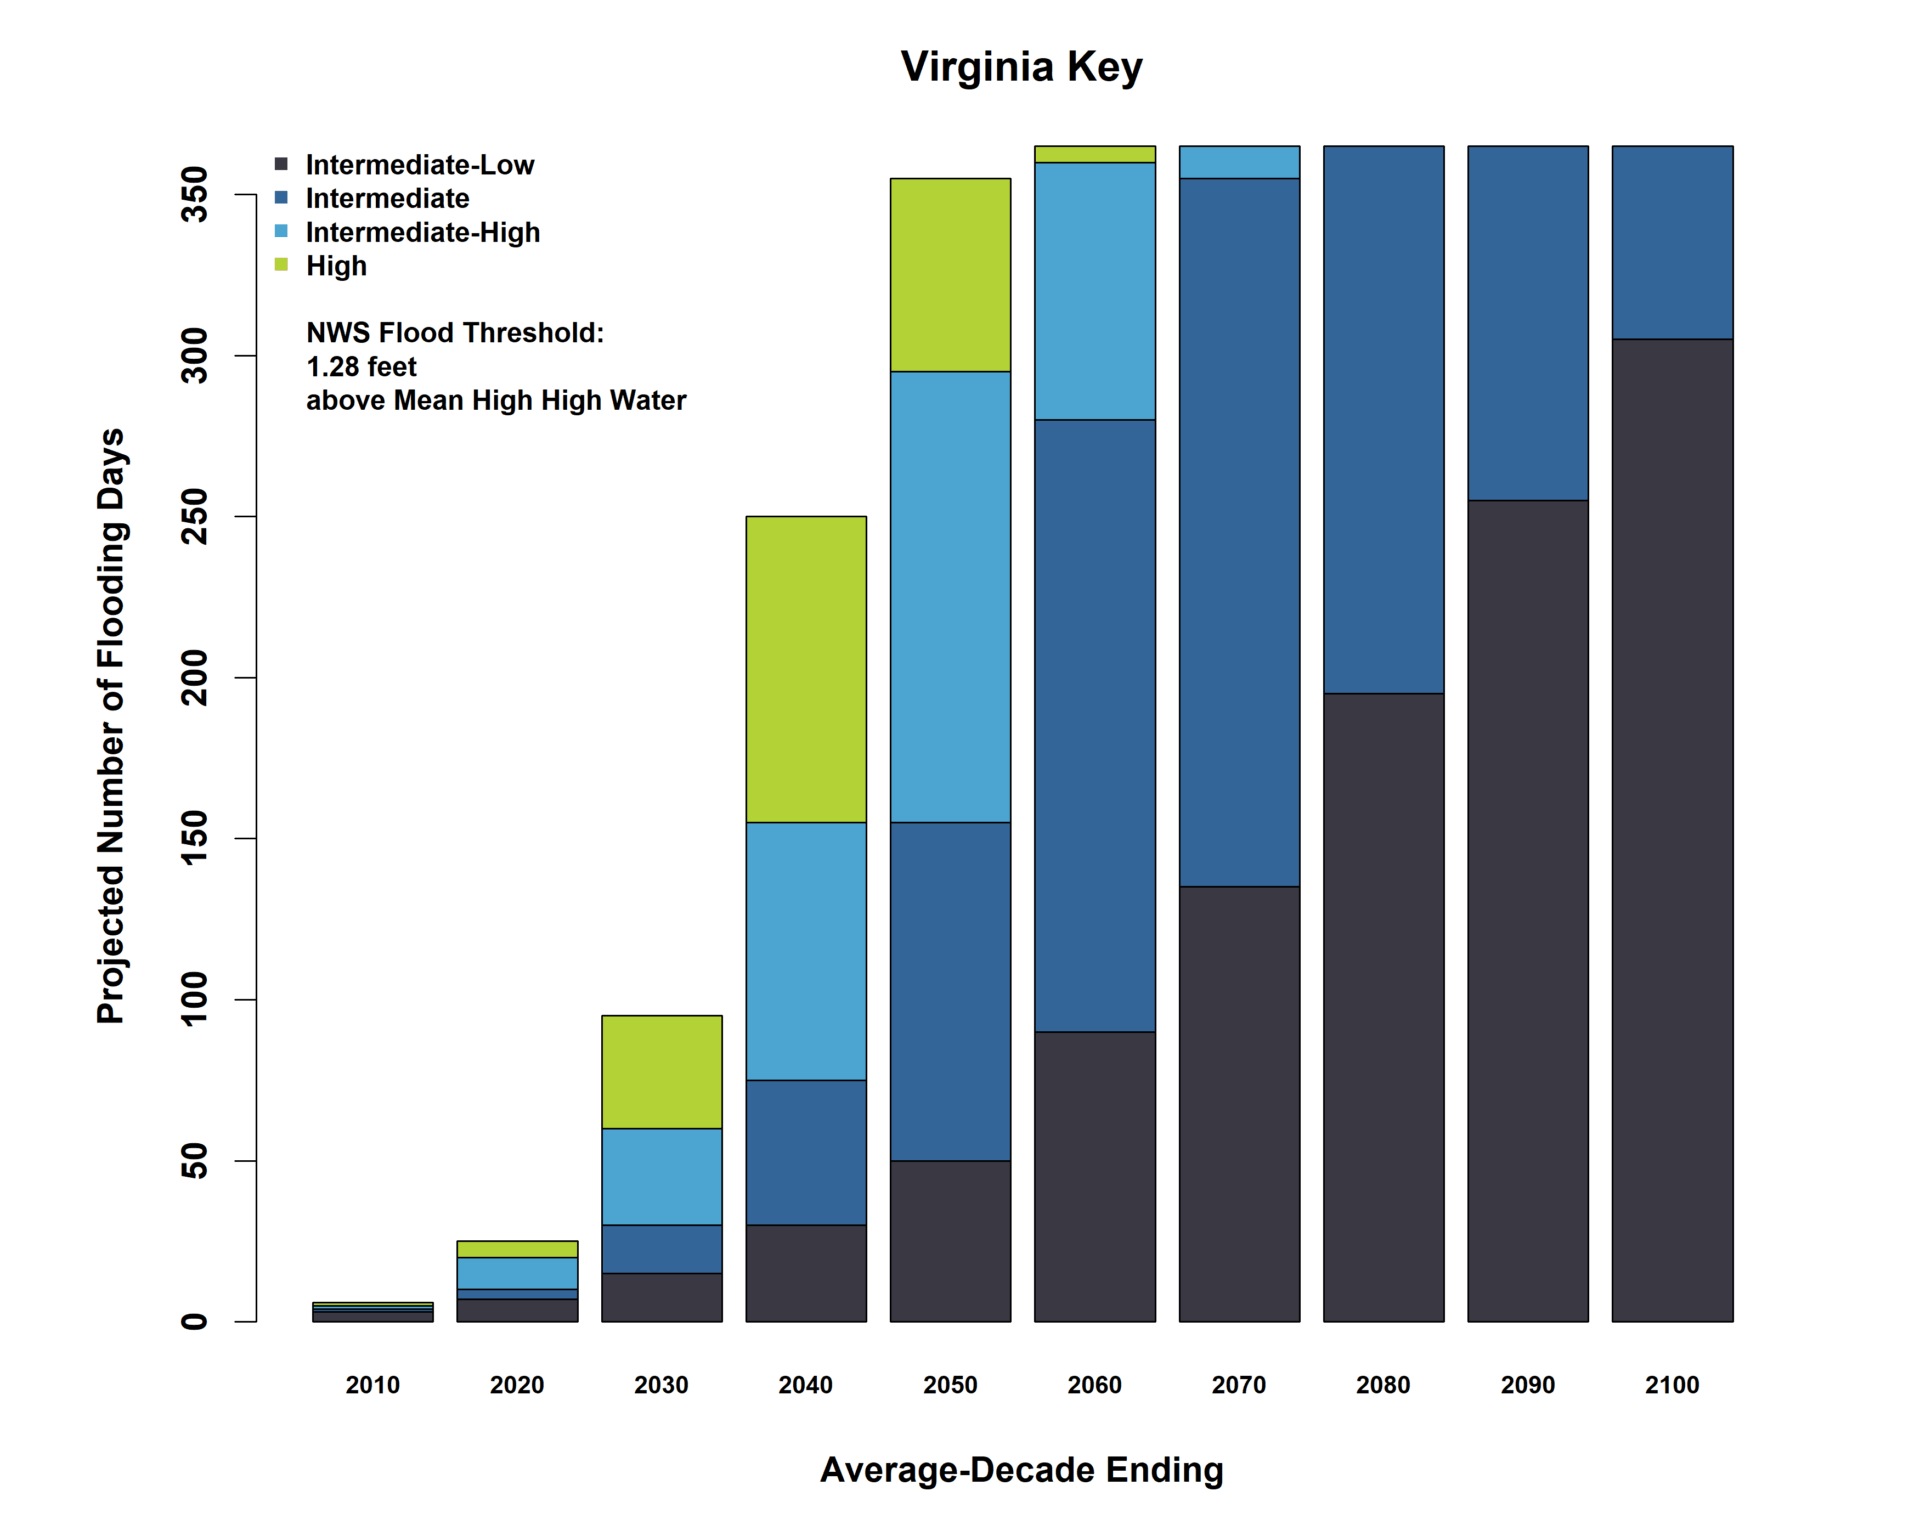
Projected High Tide Flooding
The charts show the projected number of flooding days at tidal gauges in Miami-Dade and Monroe counties, by county, from 2010 to 2100. Note that the scenarios within charts (i.e., “intermediate-low”, “intermediate”, “intermediate-high,” etc.) correspond to the sea level rise projection curves for Southeast Florida. For the below projections, a “flooding day” is considered when the daily maximum exceeds the NWS minor flood threshold. Typically, high tide flooding occurs when the tides exceed the mean higher high water (essentially the average high tides) by a certain amount, depending on the topography of the specific location.
Miami-Dade County
Monroe County
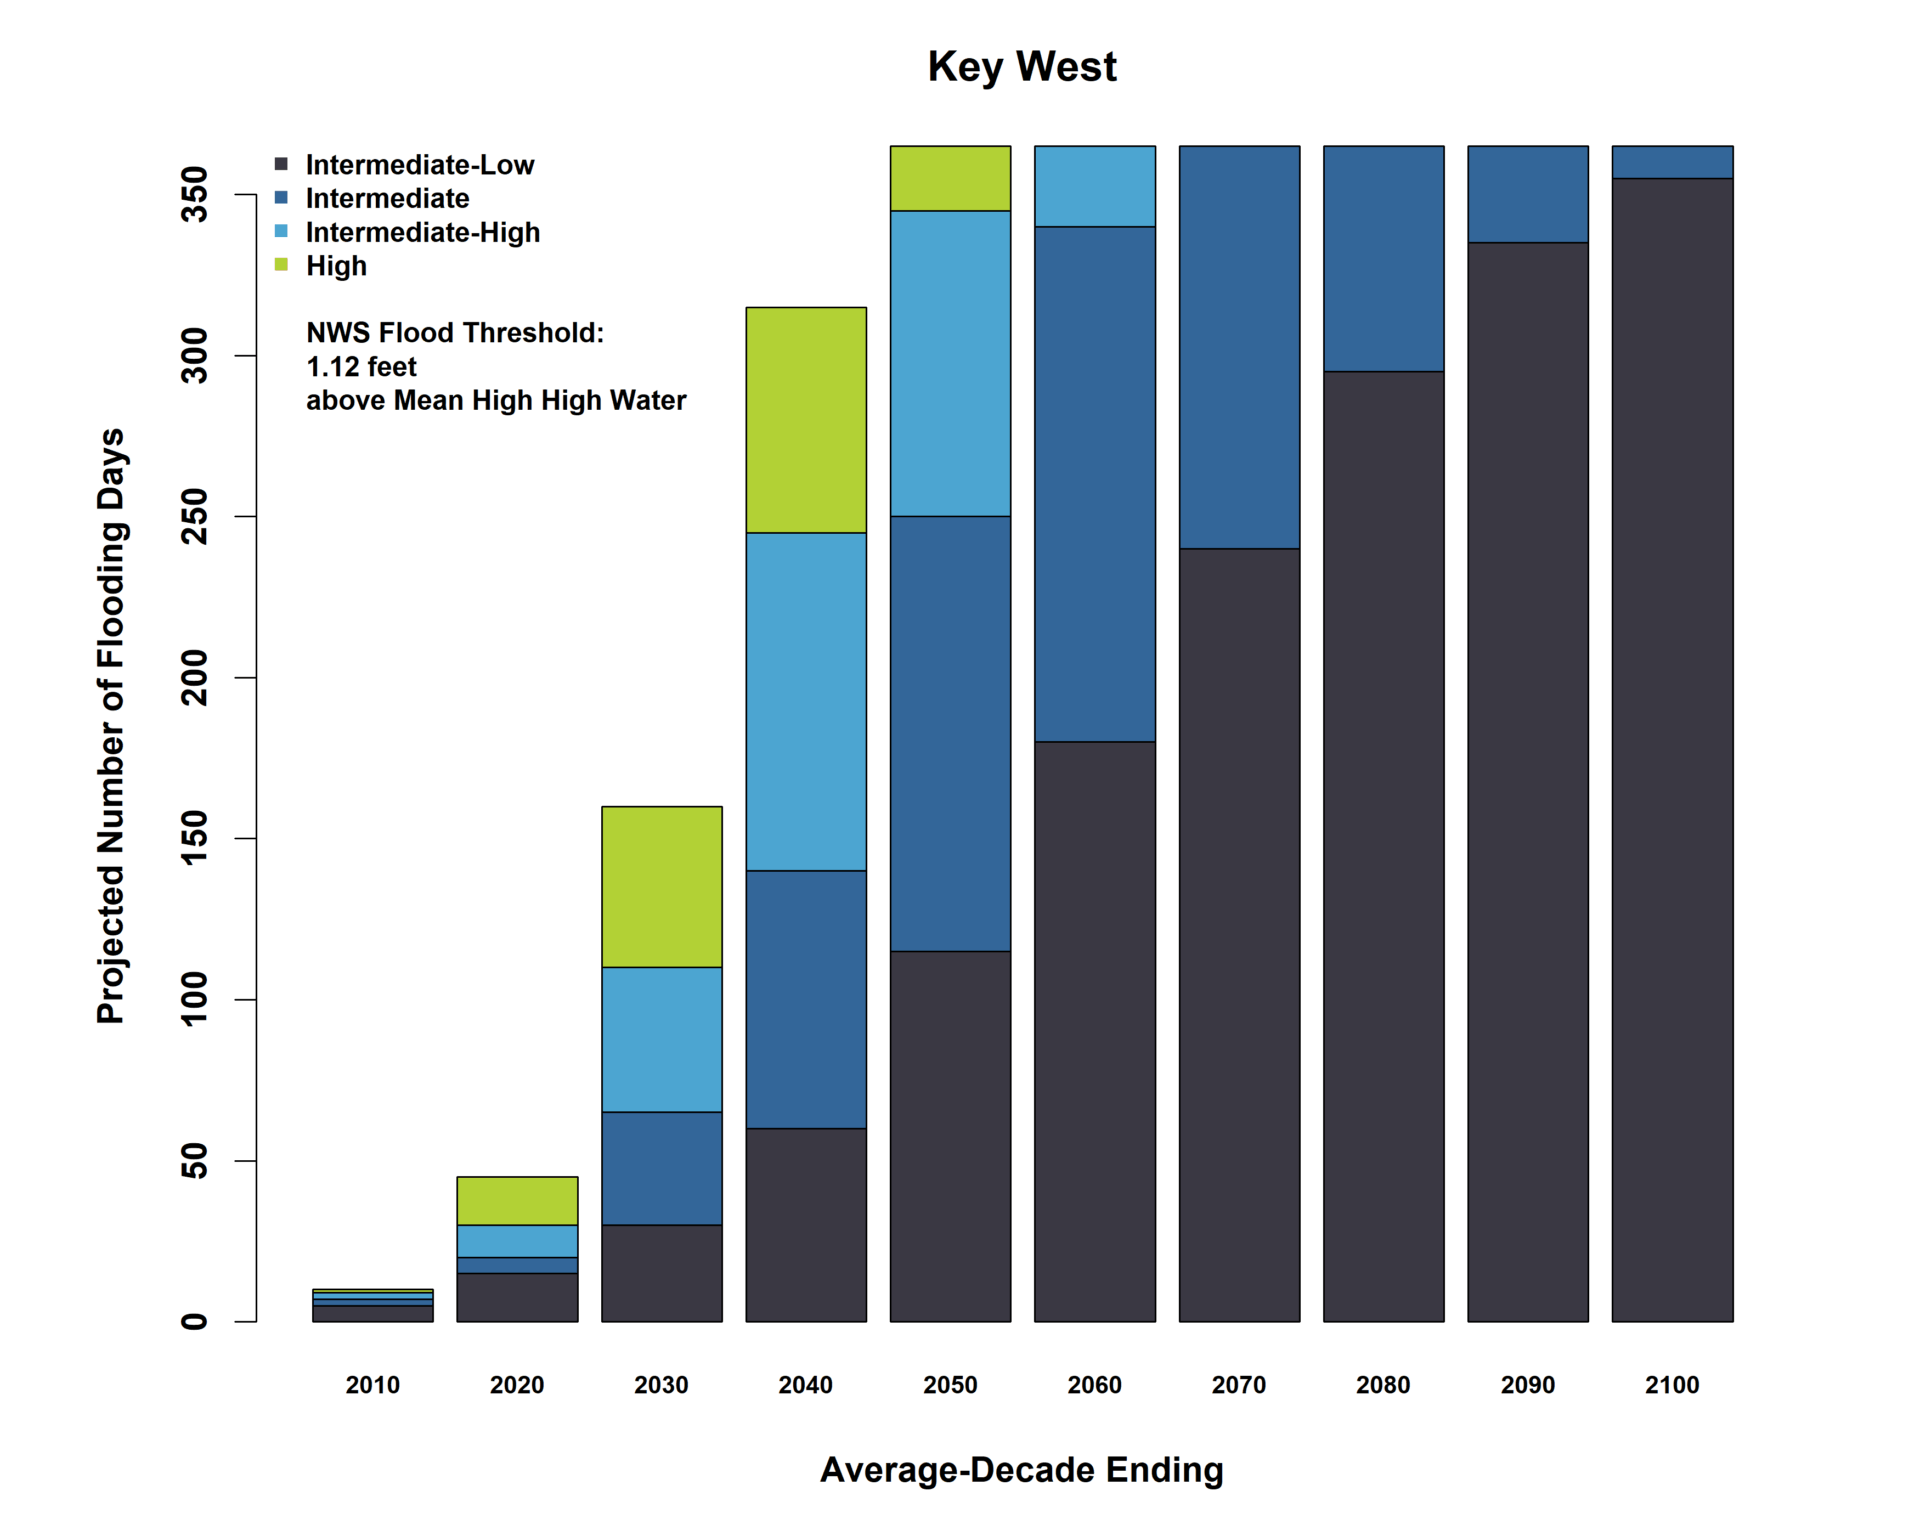
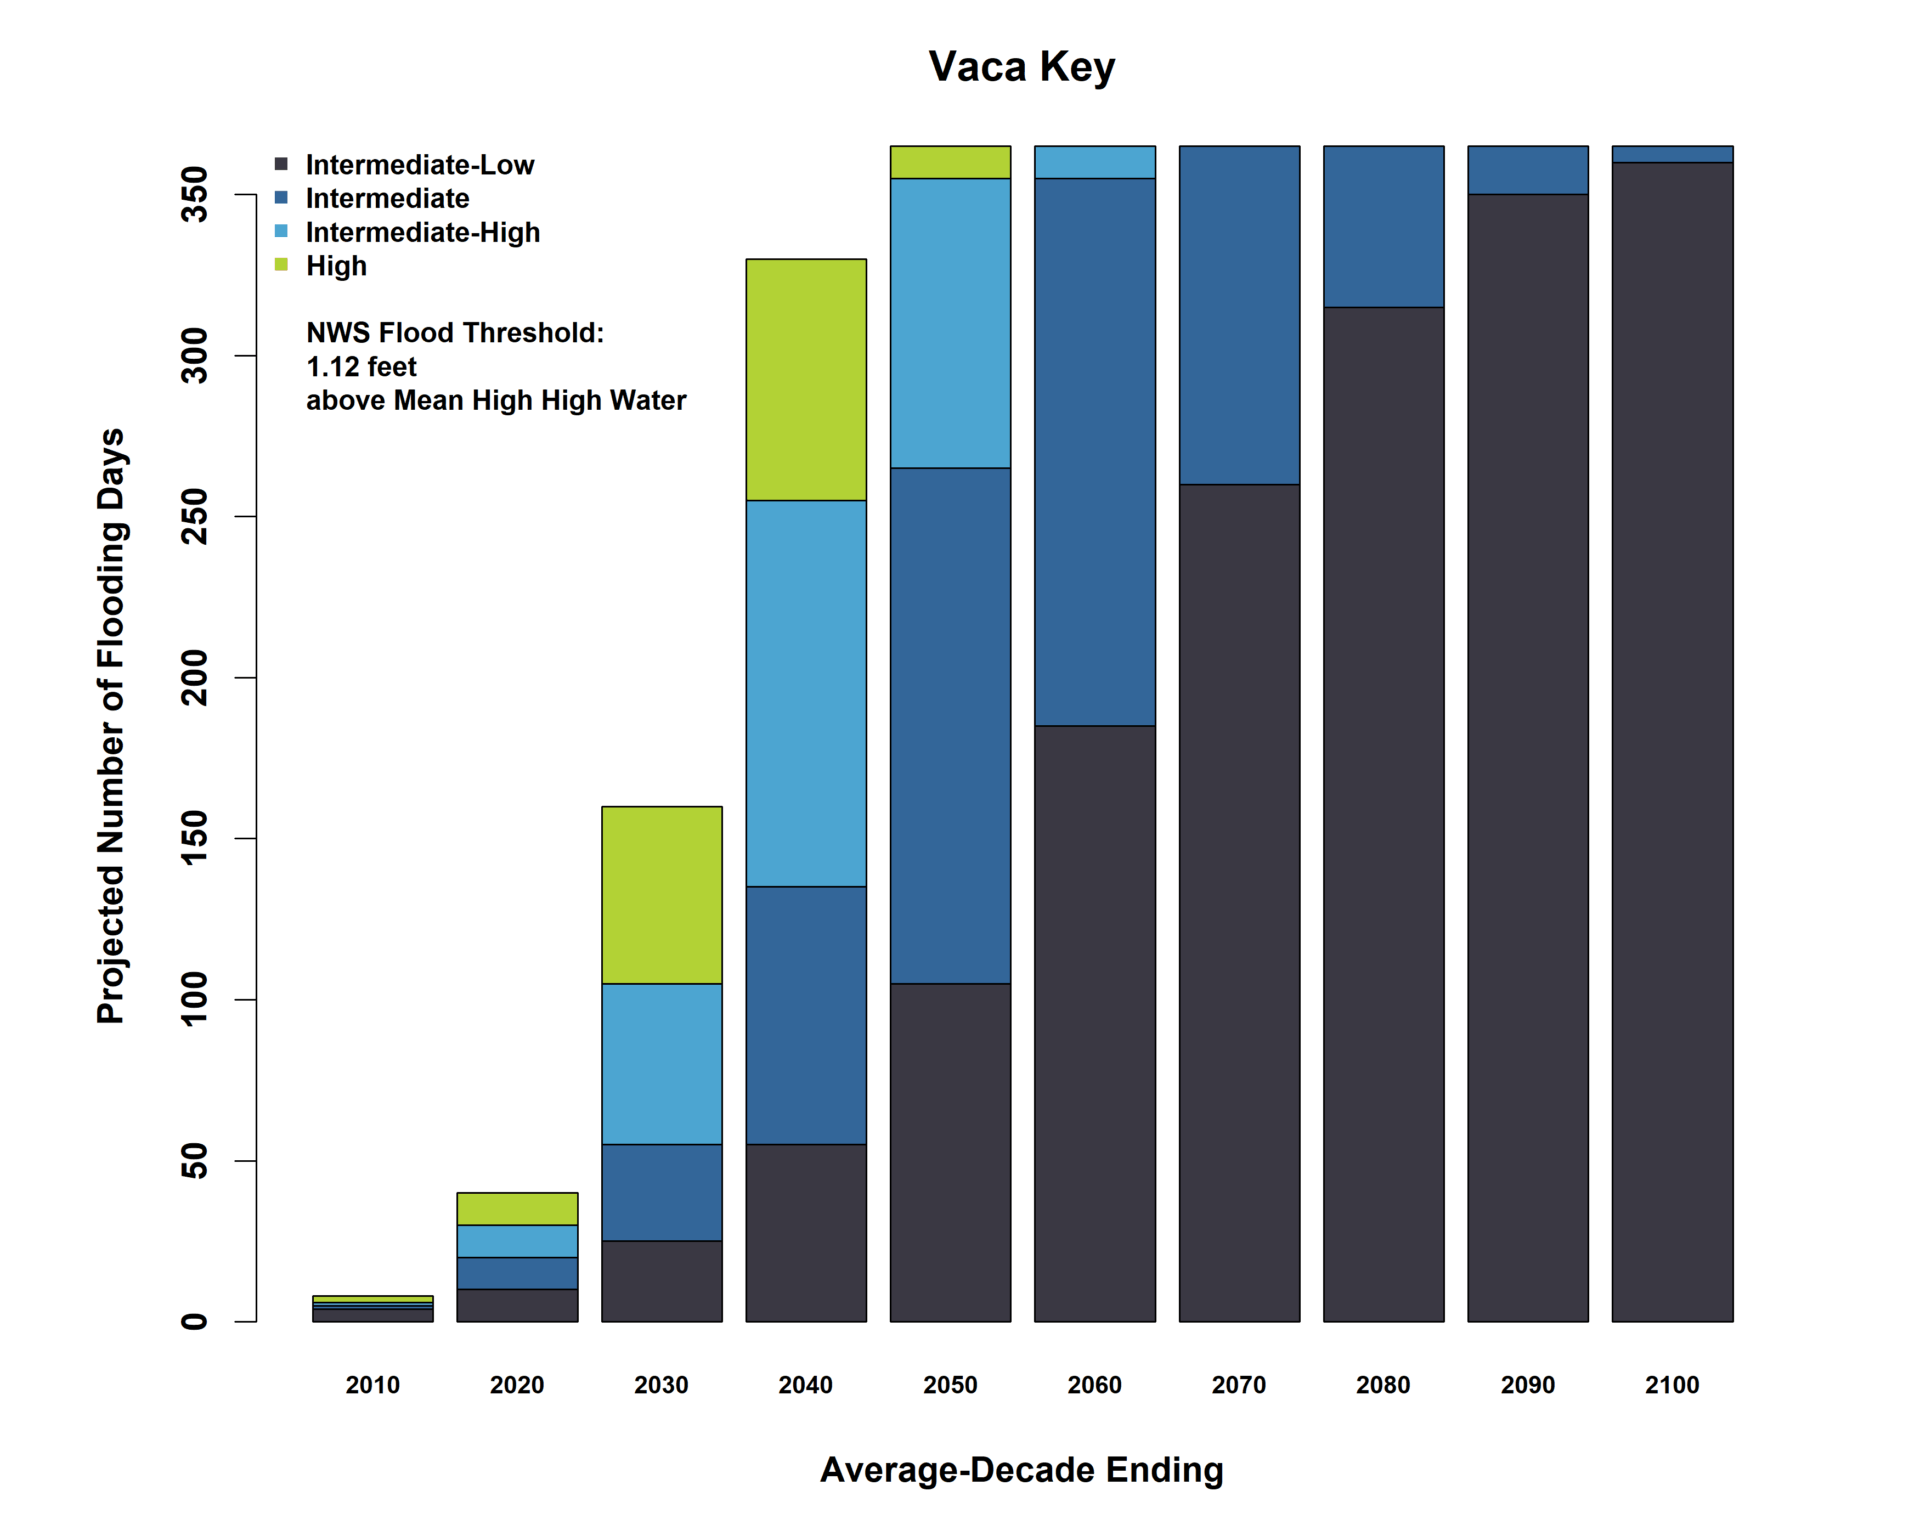
Source: Data computed and provided by William Sweet, NOAA.
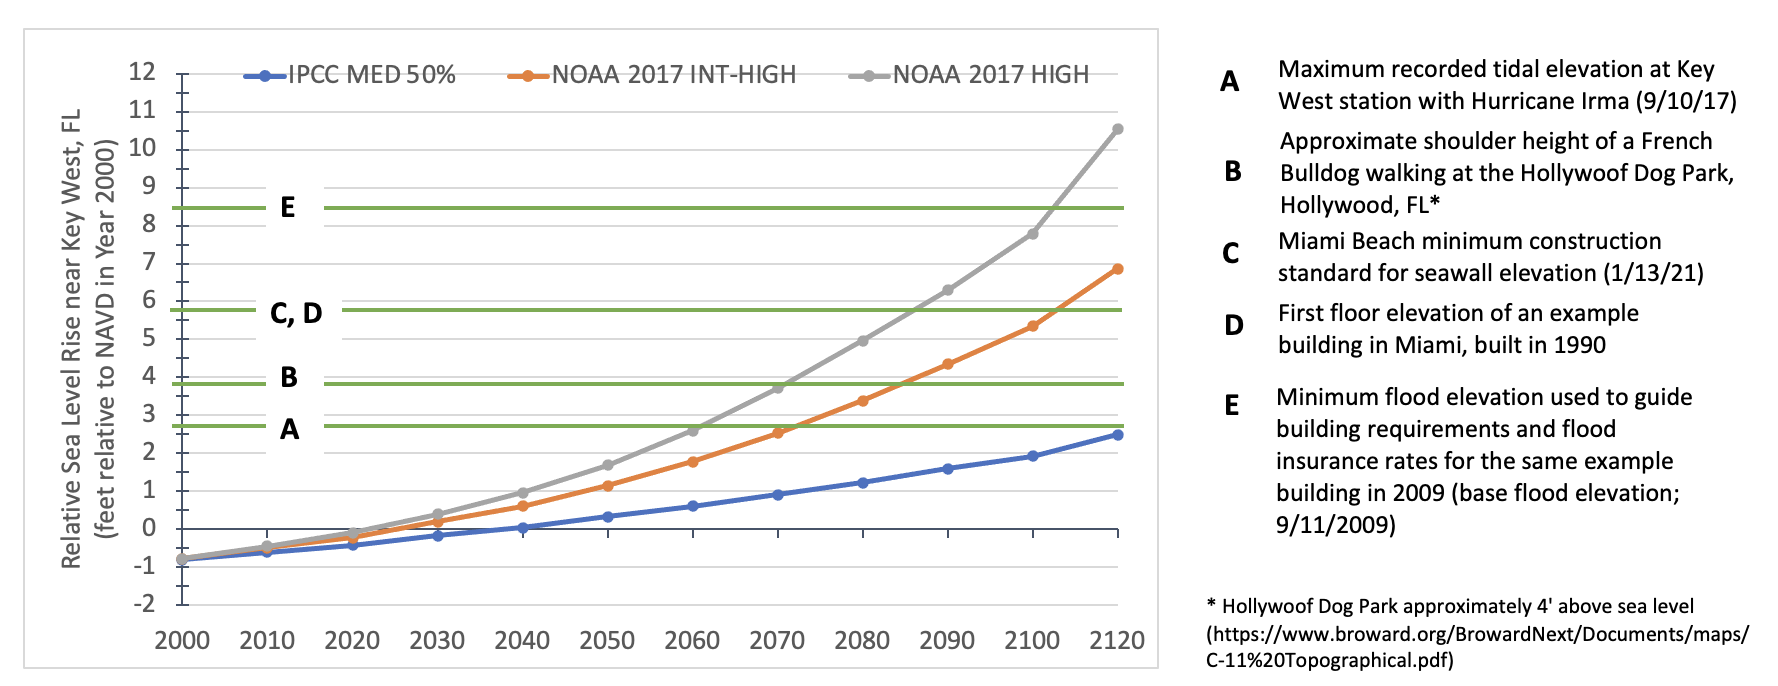
In order to help contextualize sea level rise and high tide flooding, the chart below illustrates the sea level rise projections and the NOAA NWS minor flood threshold (Virginia Key station) relative to the built environment and various planning standards, such as base flood elevation, first floor elevation, and seawall elevation within the region.